2024 Pennsylvania Polling: Focusing on Performance in the Horse Race isn’t Good Enough
We explore how oversimplified postmortem polling assessments can be more harmful than helpful.
Dear Readers,
This month’s newsletter shows that the polls in Pennsylvania performed well this year by the traditional measures pollsters and reporters use to judge their performance. It also explores how these simple postmortem polling assessments can be more harmful than helpful if that’s all anyone thinks about.
Thank you for reading,
Berwood Yost
The Pennsylvania Polls Performed Well
Pennsylvania’s 2024 final election results, which were officially certified on December 4th, showed that Donald Trump beat Kamala Harris 50.4 to 48.7 (1.7 points) and that David McCormick beat Bob Casey 48.8 to 48.6 (0.2 points). The polls conducted in the state showed that both races would be close, and in the end they were mostly correct about how close the race would be (Table 1).
Table 1. Poll Performance for the 2024 Presidential and Senate Races[i]
|
Biased |
Candidate Error |
Absolute Error |
Signed Error |
Correct winner |
Dem Share |
Rep Share |
|
|
President |
11% |
0.5 |
1.6 |
1.0 |
57% |
47.9 |
48.6 |
|
Final Week (n=14) |
14% |
0.5 |
1.9 |
1.1 |
57% |
48.2 |
48.9 |
|
Two Weeks Prior (n=10) |
0 |
0.6 |
1.2 |
1.1 |
50% |
47.6 |
48.2 |
|
Three Weeks Prior (n=4) |
25% |
0.2 |
1.7 |
0.4 |
75% |
47.3 |
48.5 |
|
Senate |
33% |
1.1 |
2.5 |
2.2 |
26% |
48.1 |
46.1 |
|
Final Week (n=14) |
43% |
1.0 |
2.6 |
2.1 |
21% |
48.4 |
46.5 |
|
Two Weeks Prior (n=10) |
30% |
1.4 |
2.9 |
2.9 |
20% |
47.8 |
45.1 |
|
Three Weeks Prior (n=3) |
0 |
0.1 |
0.7 |
0.2 |
67% |
47.7 |
47.7 |
The error measurements shown in Table 1 are small for both races, although the errors were about twice as large and more were biased in the senate race than the presidential race (see the end notes for a description of each error measurement, and to see which individual polls were biased).[ii] Just over half of the presidential polls accurately predicted a Trump win, which is what one would expect in a race that is essentially a toss-up. Far fewer polls, only one in four, accurately predicted a McCormick win. The average of the polls conducted in the last three weeks of the election gave Trump a 48.6 to 47.9 advantage. The average of the polls in that same time period showed McCormick trailing Casey by two points, 46.1 to 48.1. The overall miss for McCormick was larger (2.7 points too low) than it was for Trump (1.8 points too low).
Compared to prior presidential races, the 2024 presidential polls in Pennsylvania had their best performance since 2008 (see Table 2). Hooray?
Table 2. Poll Performance in Pennsylvania Presidential Elections, 2008 - 2024[iii]
|
Election Year |
Biased |
Candidate Error |
Absolute Error |
Signed Error |
Correct Winner |
|
2008 |
23% |
-0.6 |
2.6 |
-1.2 |
100% |
|
2012 |
25% |
-0.6 |
2.3 |
-1.2 |
94% |
|
2016 |
66% |
2.2 |
4.7 |
4.5 |
7% |
|
2020 |
48% |
1.5 |
3.9 |
3.0 |
79% |
|
2024 |
11% |
0.5 |
1.6 |
1.0 |
57% |
The Risks of Oversimplifying Election Poll Performance
The polls in Pennsylvania performed well this year by the traditional measures pollsters and reporters use to judge their performance. But these simple postmortem polling assessments can be more harmful than helpful if that’s all anyone thinks about.
For one, these simple assessments imply that polls are precision tools because they present polling misses to the tenth of a point. Every survey based on random sampling has significant variability, and talking about their results to the decimal point creates a false impression about how closely they can actually capture the final results.
Second, focusing on the horse race, as these assessments always do, ignores the valuable context that polls provide, whether or not they identify the winner or the winning margin. Reminding people about the context the polls provided, whether about voters’ economic concerns, their dissatisfaction with the incumbent president, or the changing preferences within voting groups, reinforces what polls can actually do well. Our final poll highlighted these patterns, but so did our polls in prior years when the final horse race numbers were not as good.[iv] Simply put, focusing on the precision of the final polls emphasizes the least useful indicator that polls gather while obscuring those things they do best.
Third, these summaries ignore the many different ways survey research is conducted by pretending that every poll is conducted the same way. In real life, how pollsters gather their data is changing, data gathering approaches are less standardized and more diverse, and a fair share of pollsters never describe how they do their work. Focusing on outcomes and not thinking about the processes that lead to those outcomes keeps us from understanding what we’re really assessing.
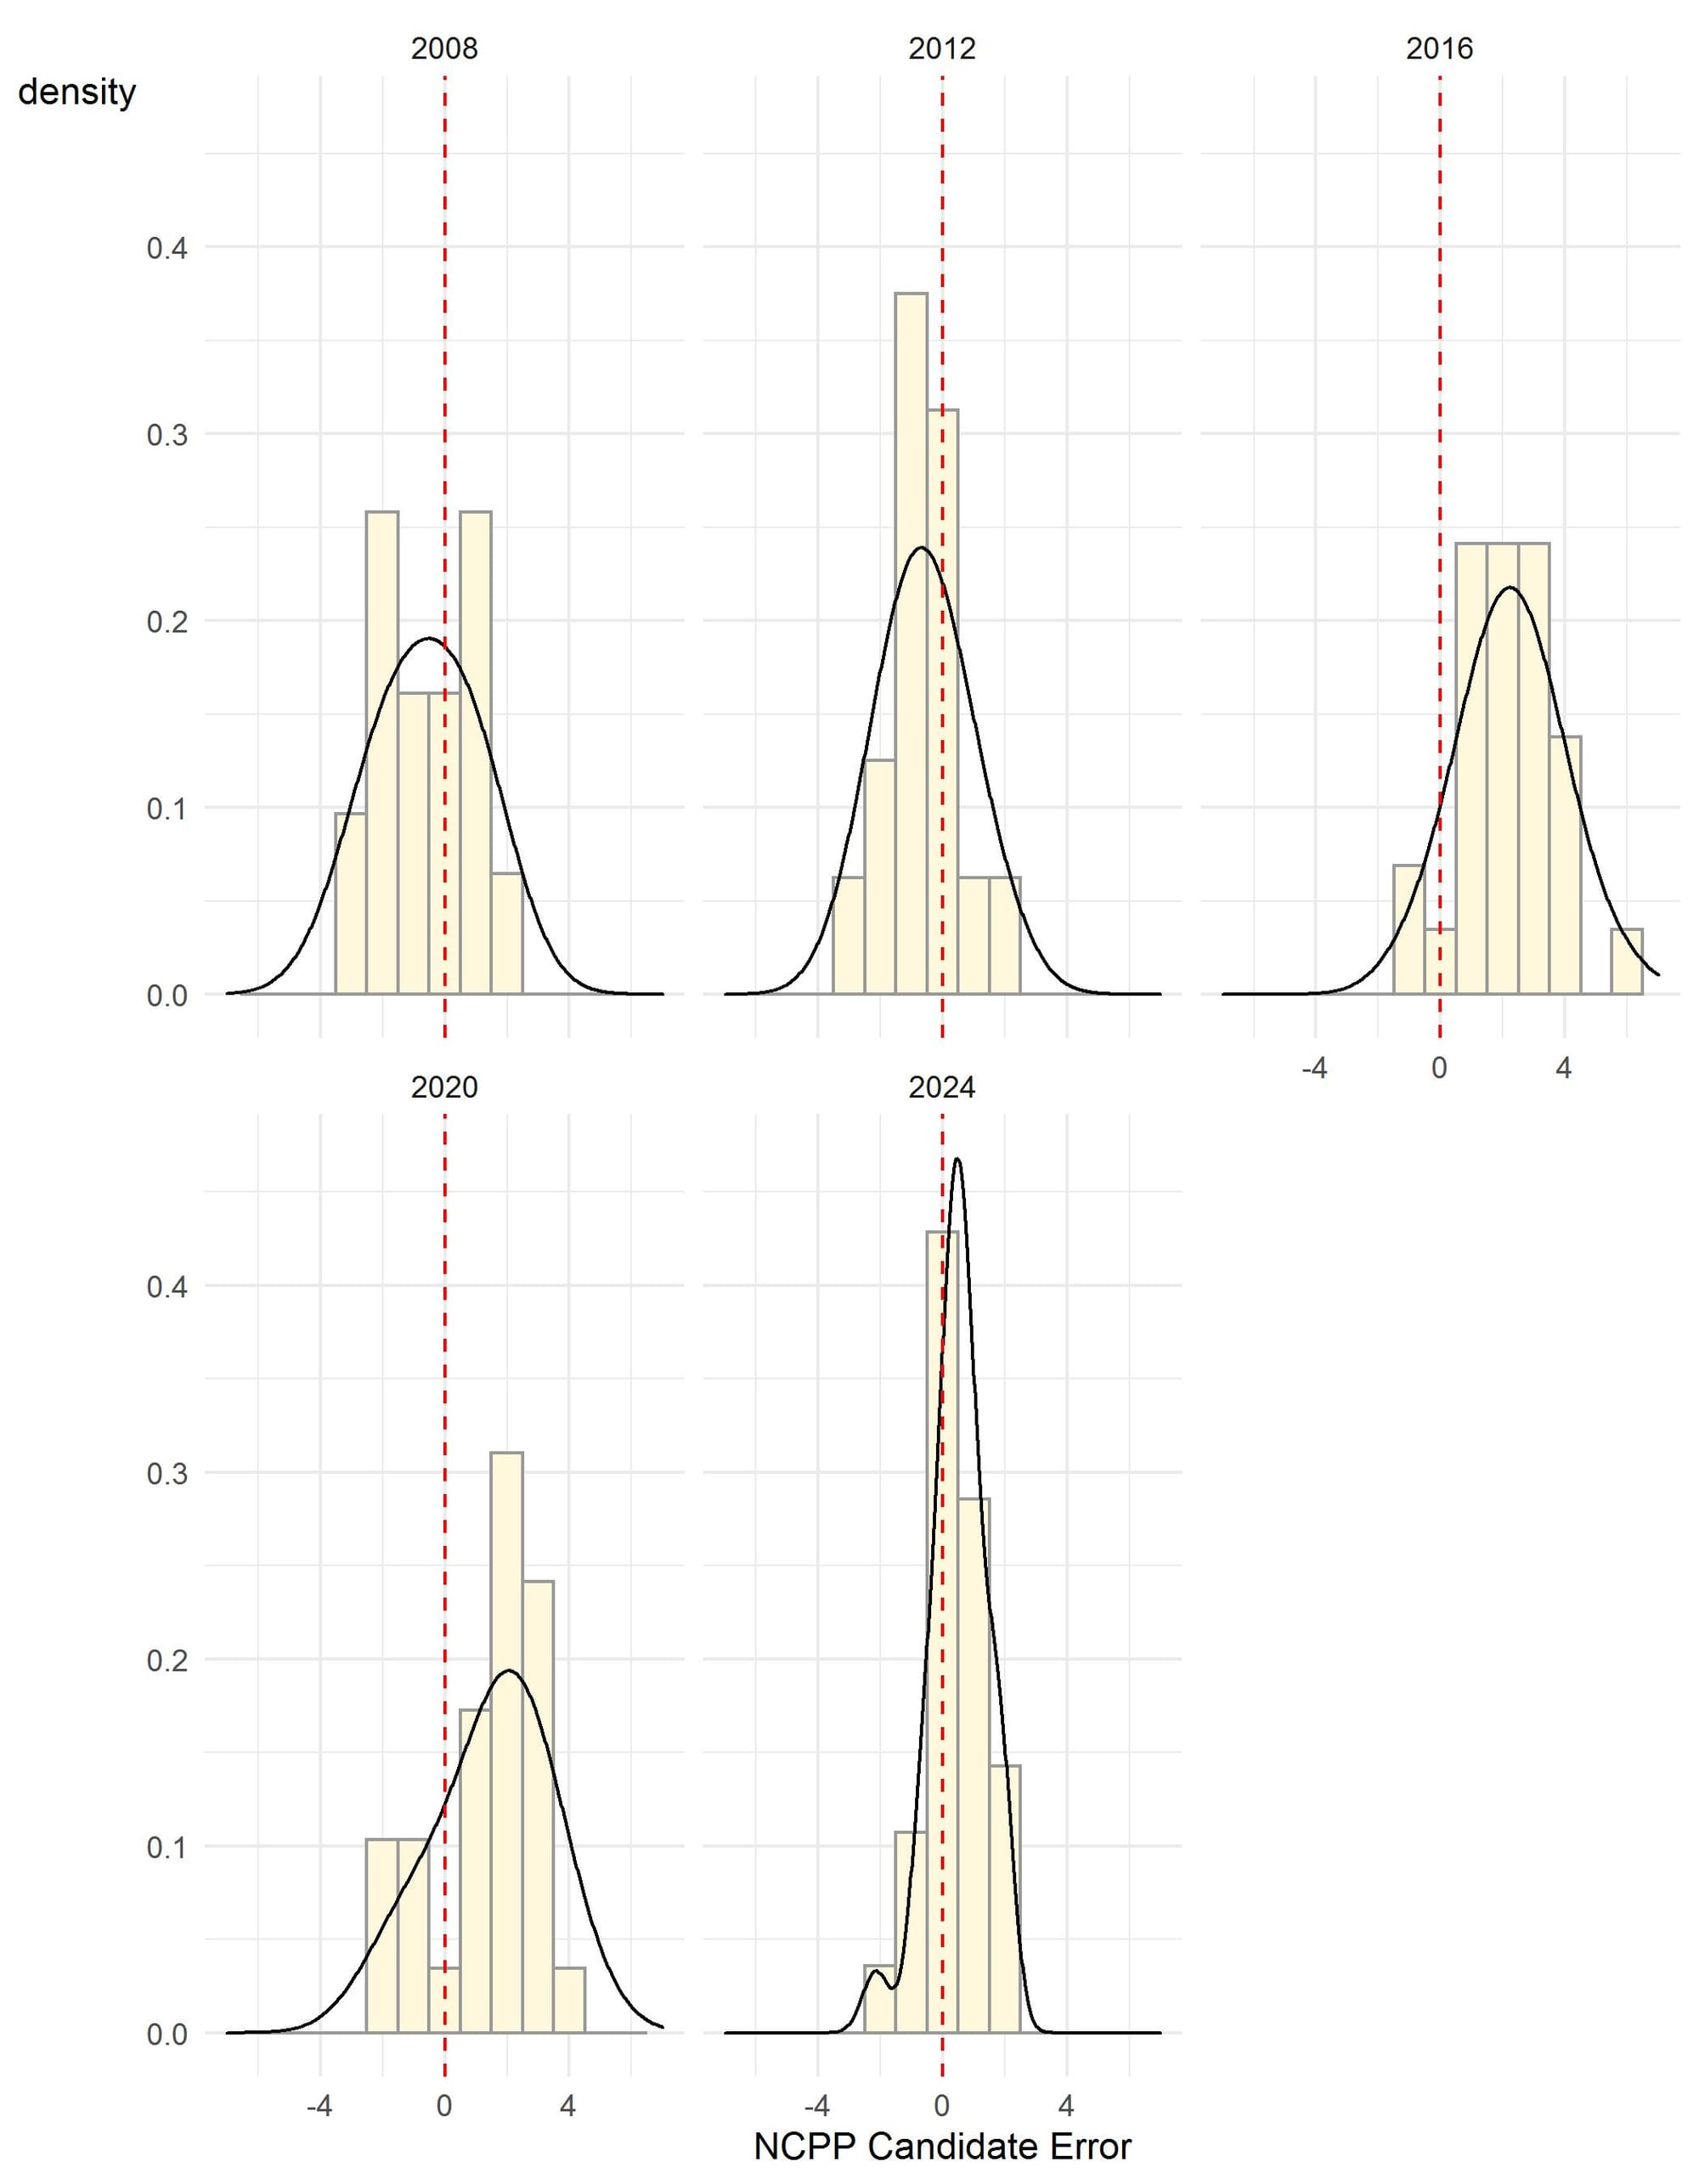
For example, the distribution of candidate error in this race compared to the candidate error in other recent elections shows that the current round of polling results are unusually different (see Figure 1). Random sampling should yield a symmetric distribution of errors around the final outcome, but in 2024 the candidate errors in the Pennsylvania polls were much narrower than in prior elections and much narrower than theory suggests they should be. The average sample error in 2024 polls was plus or minus 3.4, so most candidate error should be dispersed throughout that range, but they are not. The distribution of candidate errors was only 2.5 points this year when in prior years the candidate errors ranged from four to five points, which is about what is expected.

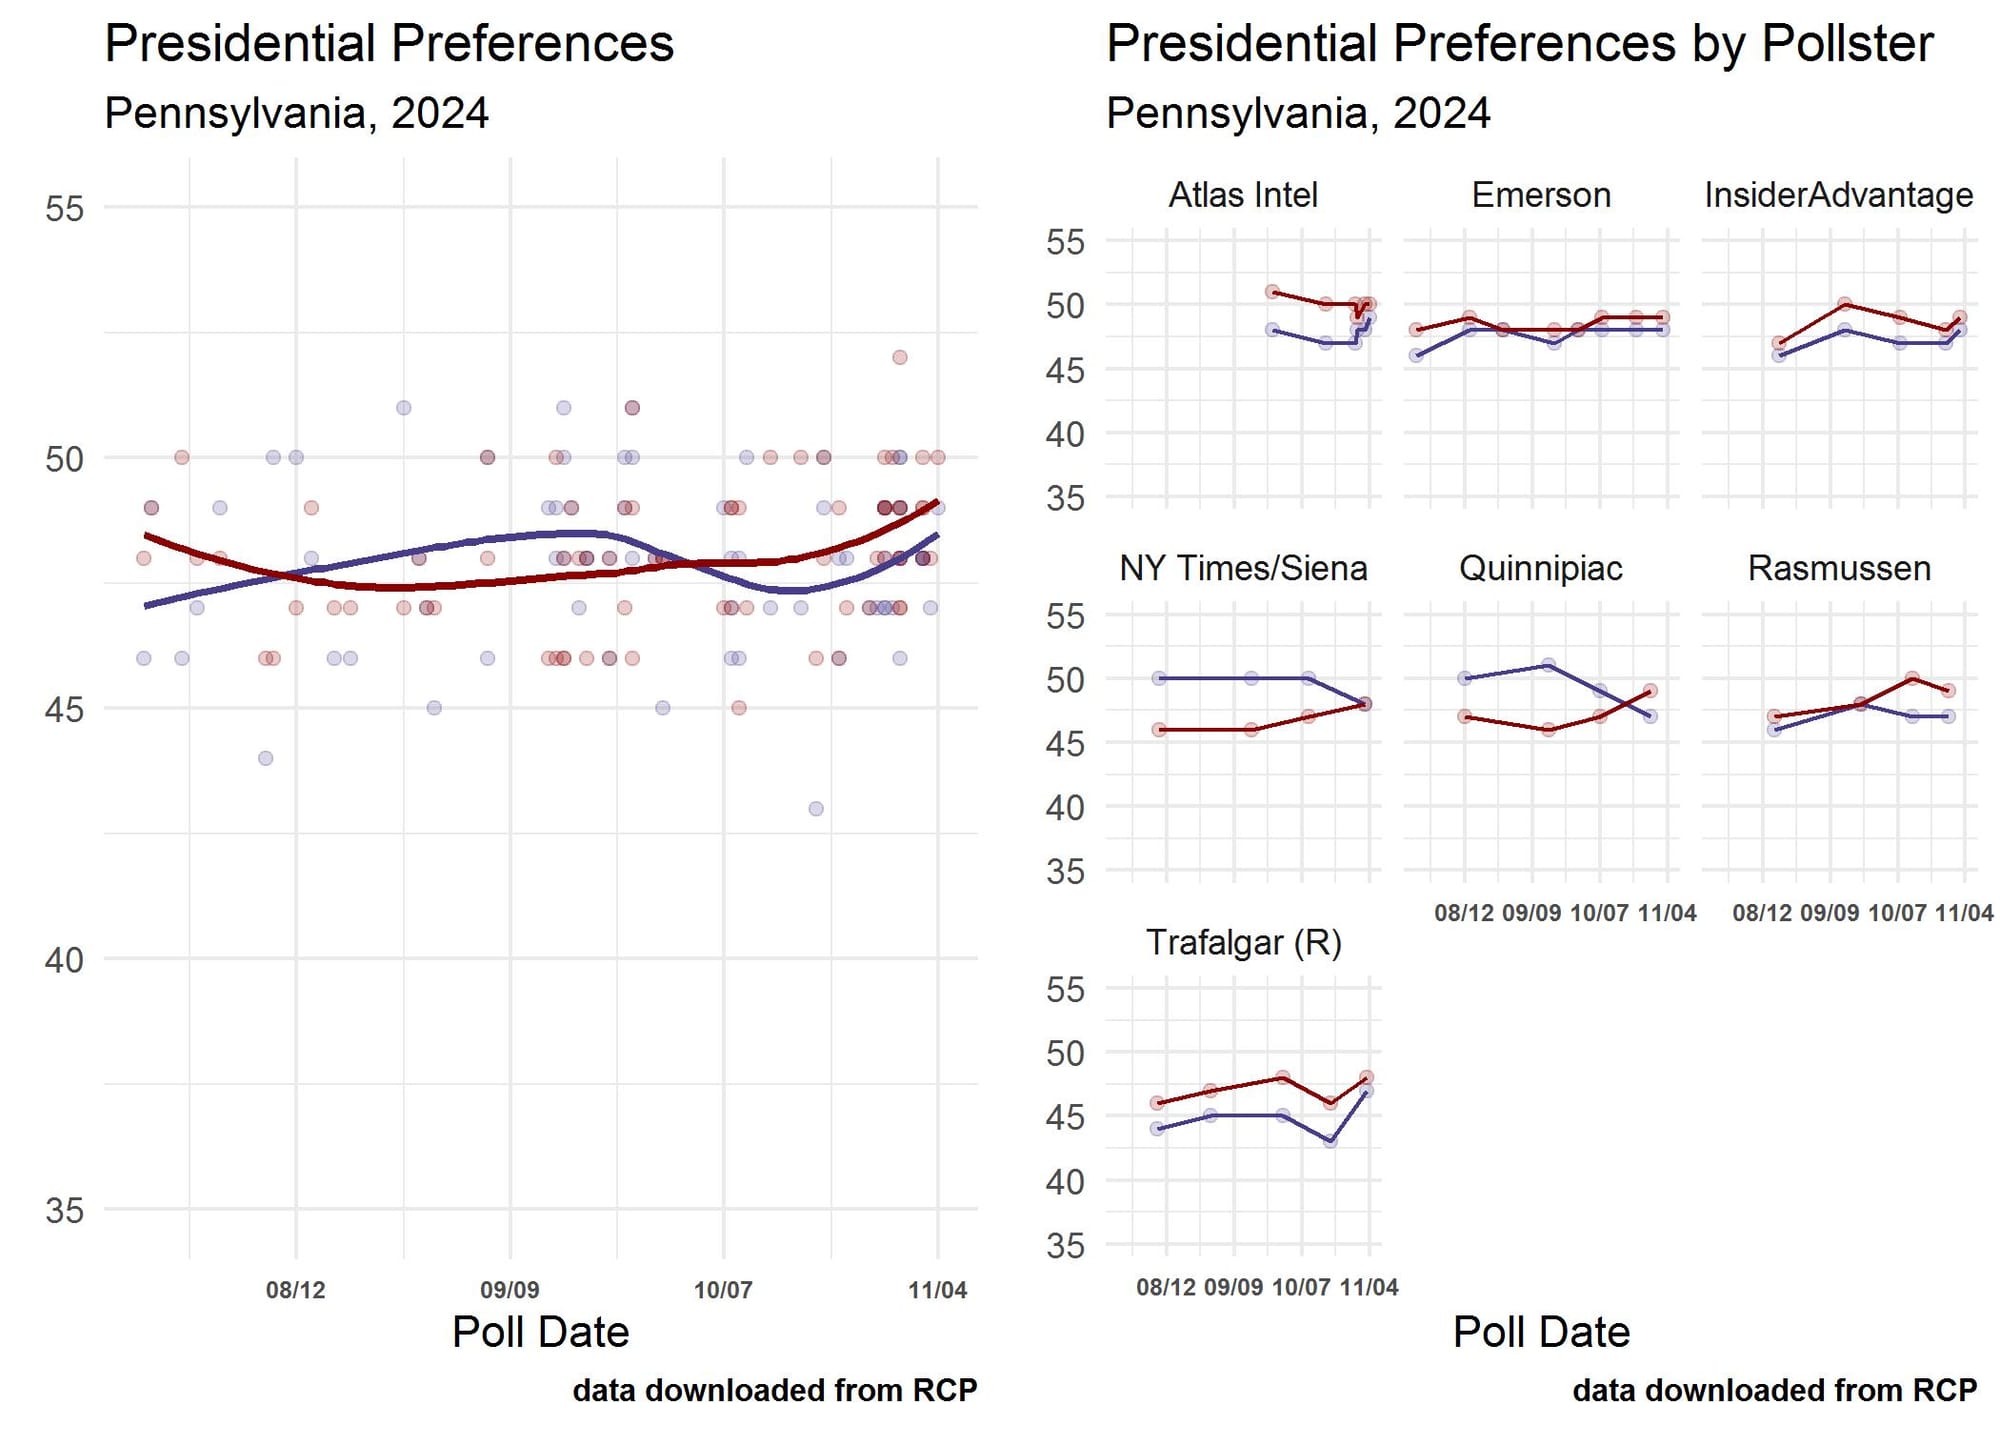
Not considering data gathering techniques and focusing on the final horse race estimates also leaves pollsters off the hook by failing to judge their overall performance and contribution to our understanding of a race throughout the entire campaign. The left panel in Figure 2 shows the overall pattern of presidential preferences in Pennsylvania from the point when Kamala Harris entered the race. The overall pattern of the race suggested some ebbs and flows for both candidates, with Harris peaking around the time of the September 10th debate and Trump gaining ground after the release of advertising aimed at Harris’s support for access to gender-affirming medical treatment for transgender people. The right panel in Figure 2 shows the patterns of response to those pollsters who released a minimum of four polls in the state. All of these pollsters basically got the final numbers correct, but only the NY Times/Siena and Quinnipiac polls showed any kind of movement in their results that reflected the broader patterns in the polls. Our F&M Polls showed movement similar to the NY Times and Quinnipiac polls.

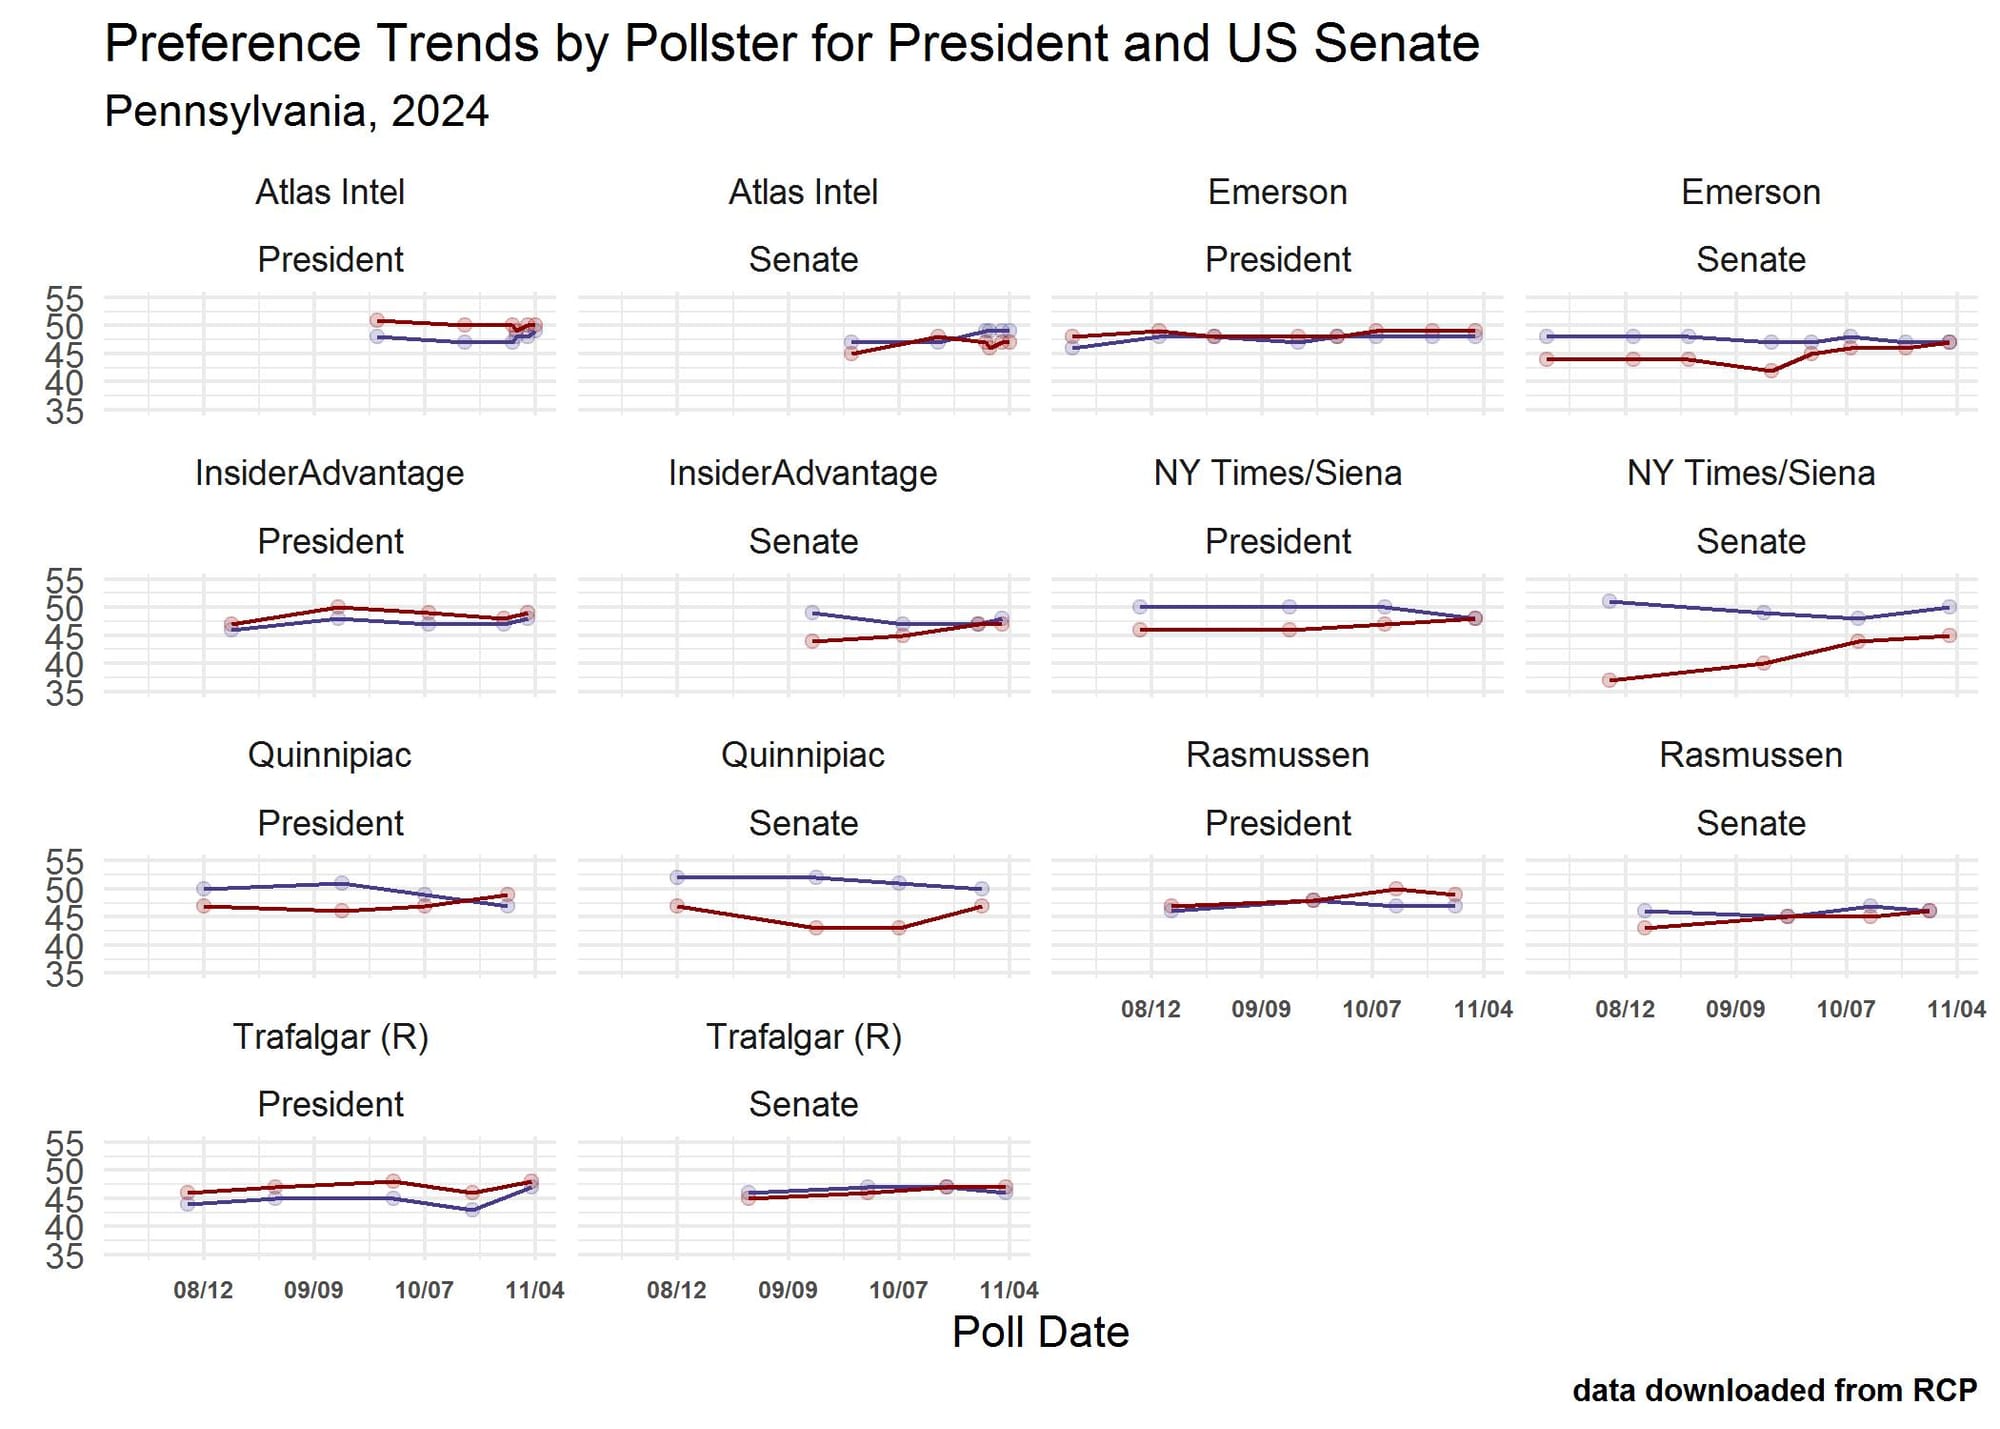
Reviewing the response patterns of the preferences for both president and senate by pollster (Figure 3) makes it clear that not every pollster is producing the same product, something we described in a post about the 2022 mid-term races. In discussing the methods used by several different pollsters in 2022 we noted that “an important issue these surveys raise is whether they are describing the race as it is, prior to Labor Day, or predicting how the race will turn out. The low numbers of undecided voters suggests the latter, and also raises an equally important question about how many voters are unsure about their decision.” It is reasonable to assume that presidential and senate preferences will converge in a time when split-ticket voting is infrequent. But it is unreasonable to expect voter preferences will be mirror images throughout a fall campaign for two races where the candidates in one race are much less well known and voters’ preferences are likely to be much more uncertain.

Poll Reporting in Context: Moving Toward a More Comprehensive Tool
Knee-jerk reporting about poll performance is a staple of post-election reporting, but readers should keep in mind just how little those analyses tend to tell us. As is often the case when people report on polls during a campaign, postmortems typically oversimplify, over-interpret, and overreach. This article from NBC News discusses the performance of the polls conducted in the last two weeks of the election and concludes with something everyone should remember: “The problem is not polling, but how polls are presented and interpreted. In fact, it is remarkable that a pollster can talk to the 800 people who agree to take a poll and get to a result within a few points of the outcome of an election in which nearly 150 million votes were cast.” This limitation extends to polling postmortems.
Poll reporting should include information about methods, about limitations, and about the meaning of polling accuracy if interested readers are ever going to understand exactly what a poll can tell them. The polling industry needs to devise a more comprehensive scorecard for assessing poll performance.
NOTES
[i] The data used for this analysis came from RealClearPolitics (accessed 11/27/2024). Polls that did not have a sample size included were removed from the final data. Some pollsters did not have estimates for sampling error, so these were calculated based on the standard formula.
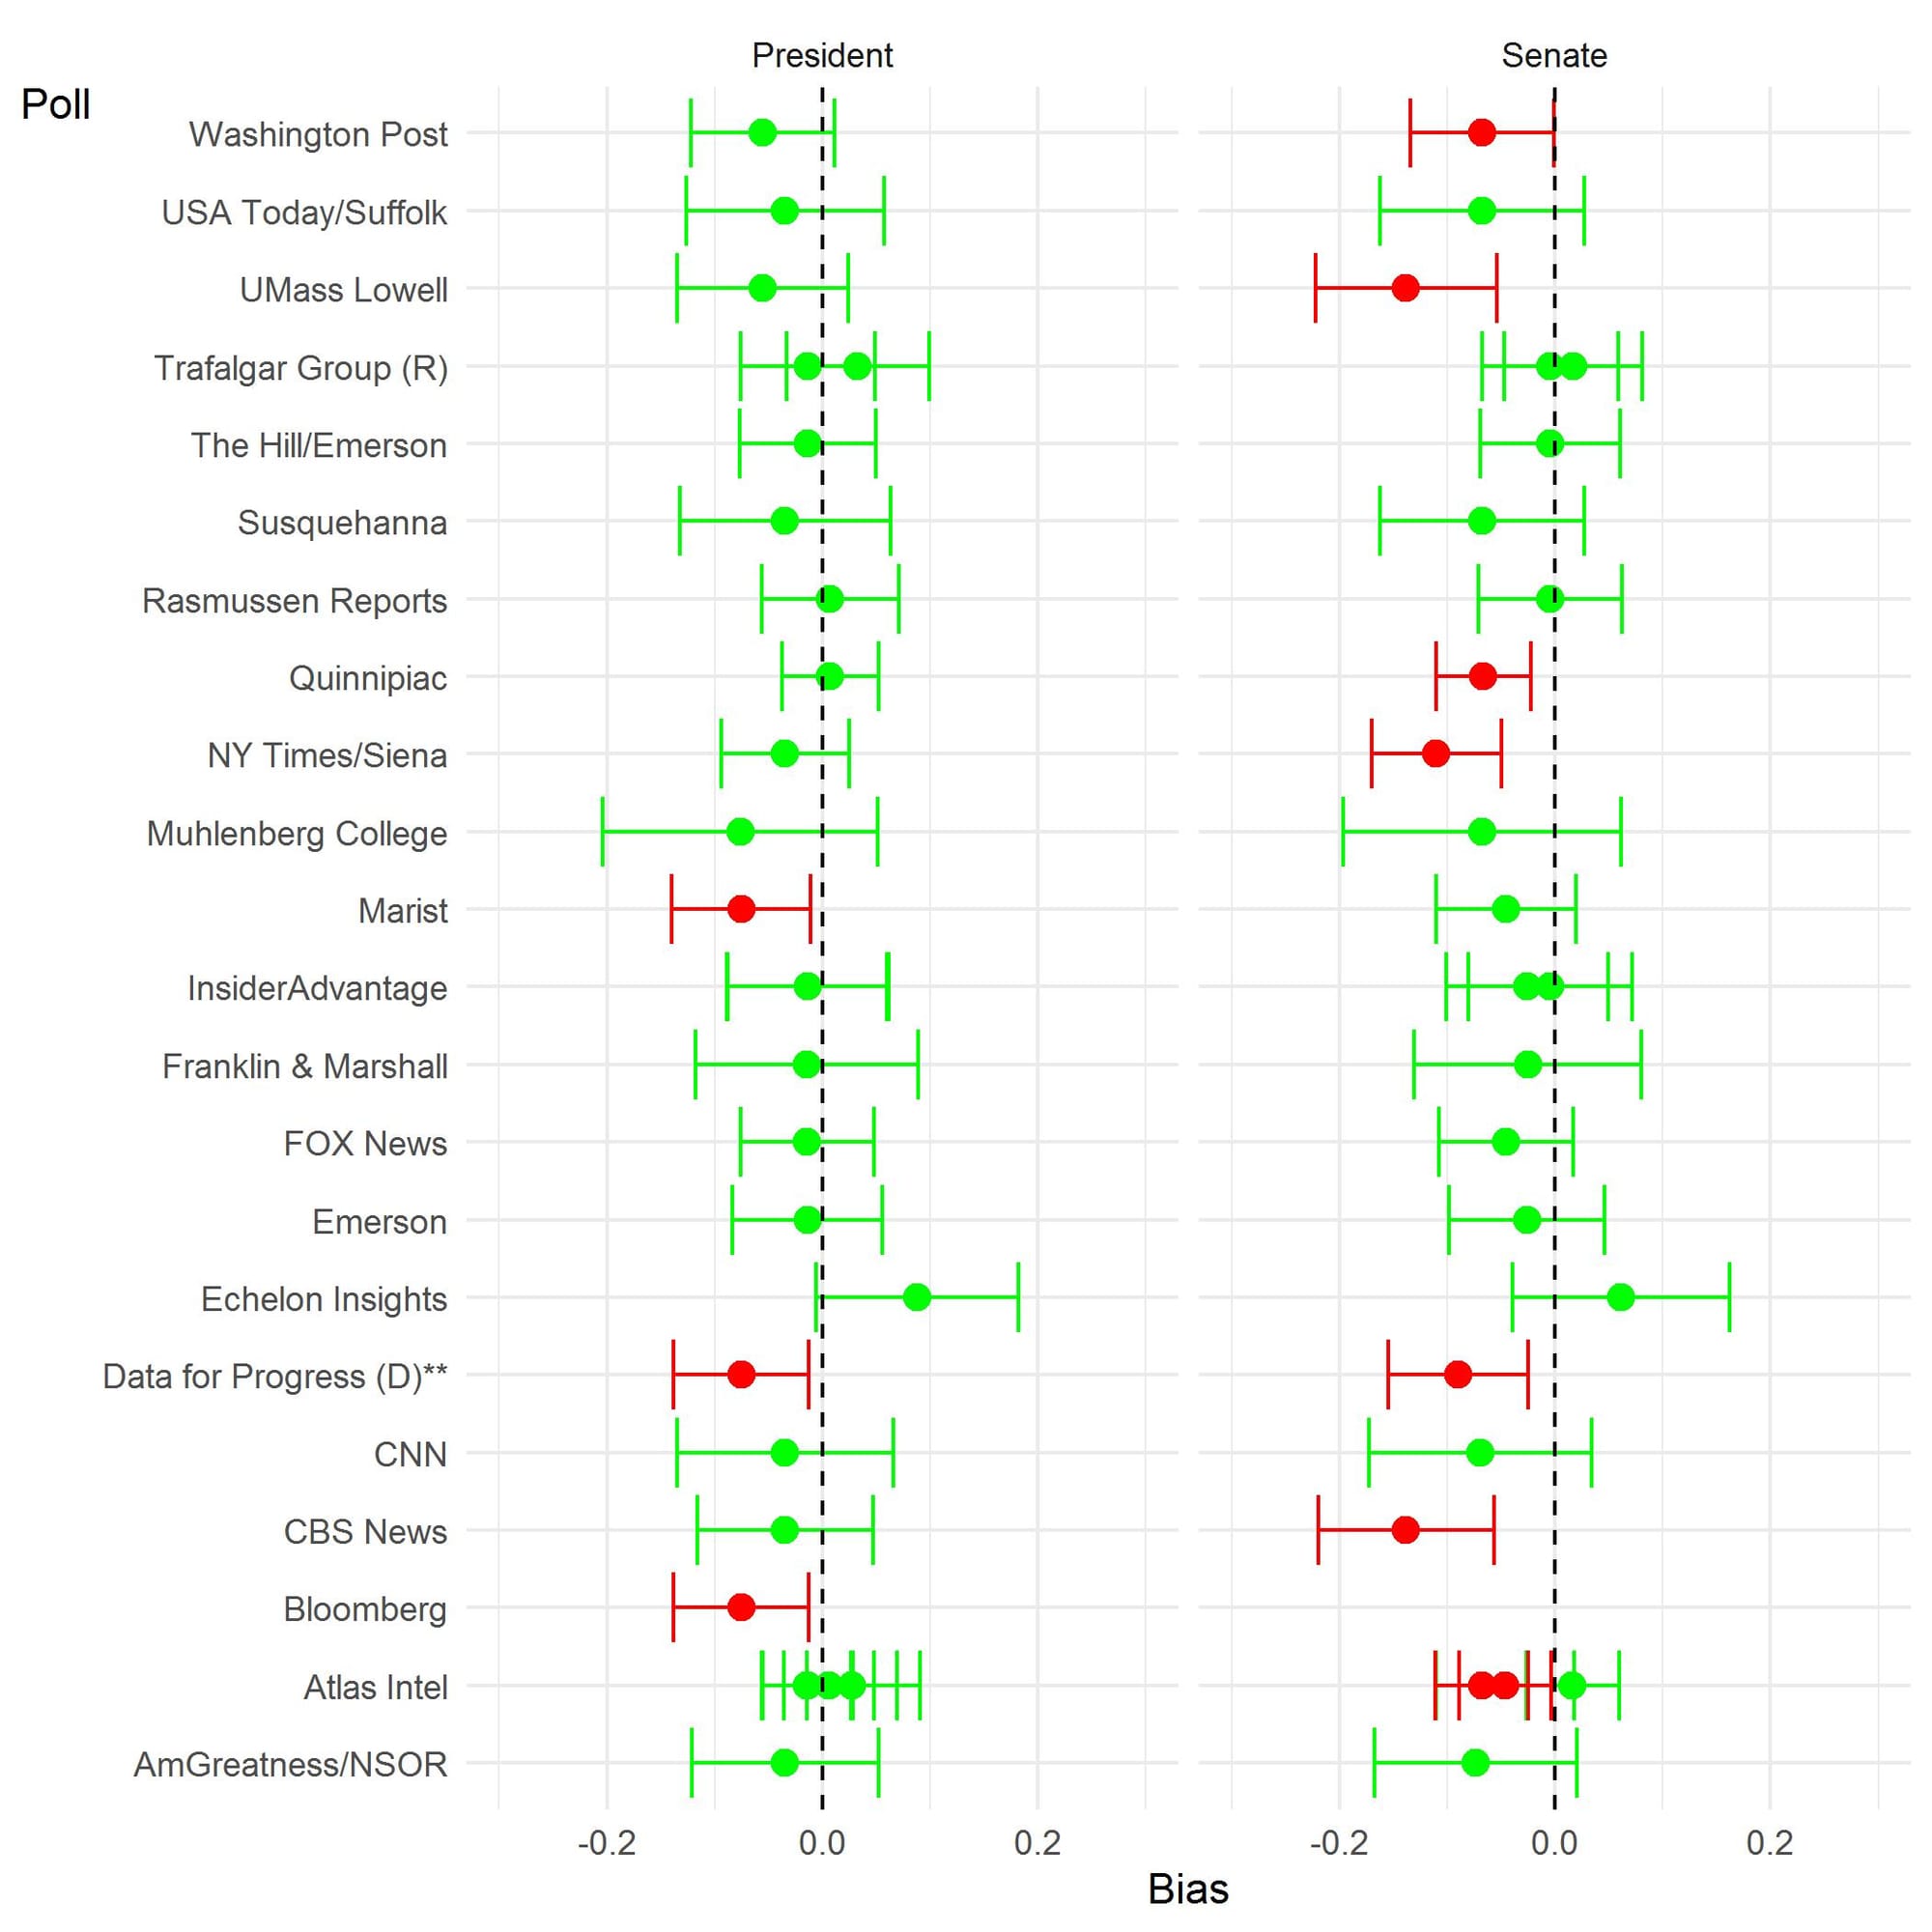
[ii] The measure of predictive accuracy A developed by Martin, Traugott, and Kennedy (2005) that compares the ratio of preferences for the major party candidates to the ratio of the final vote tally for each is used to measure bias. The natural log of this odds ratio is used because of its favorable statistical properties and the ease of calculating confidence intervals for each estimate. The confidence interval for a poll that reasonably predicts the final outcome of the election will overlap zero. Donald Trump's poll preference and vote total are the numerators in all the calculated ratios, which means a negative value for the ln odds is an overestimate in favor of Kamala Harris and a positive value is an overestimate in favor of President Trump.
Candidate error is a method used by the National Council on Public Polls (NCPP) to determine how closely published polls match the final election returns. The candidate error is one-half the error of the difference between the top two candidates. For example, the Atlas Intel survey completed the day before the election showed that President Trump led Kamala Harris 50% to 49%, a one-point gap. Subtracting the estimate (1) from the actual result (1.7) shows the poll was off by 0.7 points which is the signed error estimate. Dividing this result by two produced the final candidate error estimate of 0.35 for the survey.
[iii] The 2024 and 2020 polling results used in this analysis were taken from the RealClearPolitics website and included polls released in the three weeks prior to Election Day. The polls for the 2008, 2012, and 2016 elections were downloaded from 538. For the calculations prior to 2020 and consistent with the A methodology, the Republican candidate is used in the numerators. In all years, the sample sizes used to estimate variance are probably too large since they tend to include all respondents and not just those who had a preference for the major party candidates, and many pollsters fail to adjust for the design effects of weighting, thus over-estimating sample precision.
[iv] The Center’s assessment of the performance of polls conducted in Pennsylvania in 2020 also emphasized the value of the polls for establishing context. (See pages 6 and 7 in the summary link below.) This image displays which presidential and senate polls produced in the final three weeks of the race were biased. Biased estimates are identified by a red error bar.

Franklin & Marshall College Poll Newsletter
Join the newsletter to receive the latest updates in your inbox.
