
Democrats’ Dilemma
Should Biden stay in the presidential race, or should he step aside? We review current and historic approval ratings and other data to provide context for this important discussion.
Dear Subscribers,
President Biden’s performance in the presidential debate has created a dilemma for Democrats who are openly discussing whether he should leave the race. This month’s newsletter provides some thoughts about the debate in relation to longer-term indicators and our prior writings about the president’s performance.
Thank you for reading,
Berwood Yost
Magical Thinking?
Democrats’ operating theory in this election has been that voters’ concerns about President Biden’s performance generally, and his age and competence specifically, will ebb as voters start to pay closer attention to the campaign, learn more about the president’s notable policy wins, and are reminded about Donald Trump’s character flaws and chaotic term of office. But President Biden’s disastrous performance during the June 27th presidential debate has likely buried that hope. Last fall, 41% of Pennsylvania’s voters thought President Biden was too old to serve another term, compared to 4% who thought Mr. Trump was too old and 43% who thought they were both too old. That sentiment was unchanged throughout the early phases of the campaign, and it is difficult to imagine it has improved since the debate.
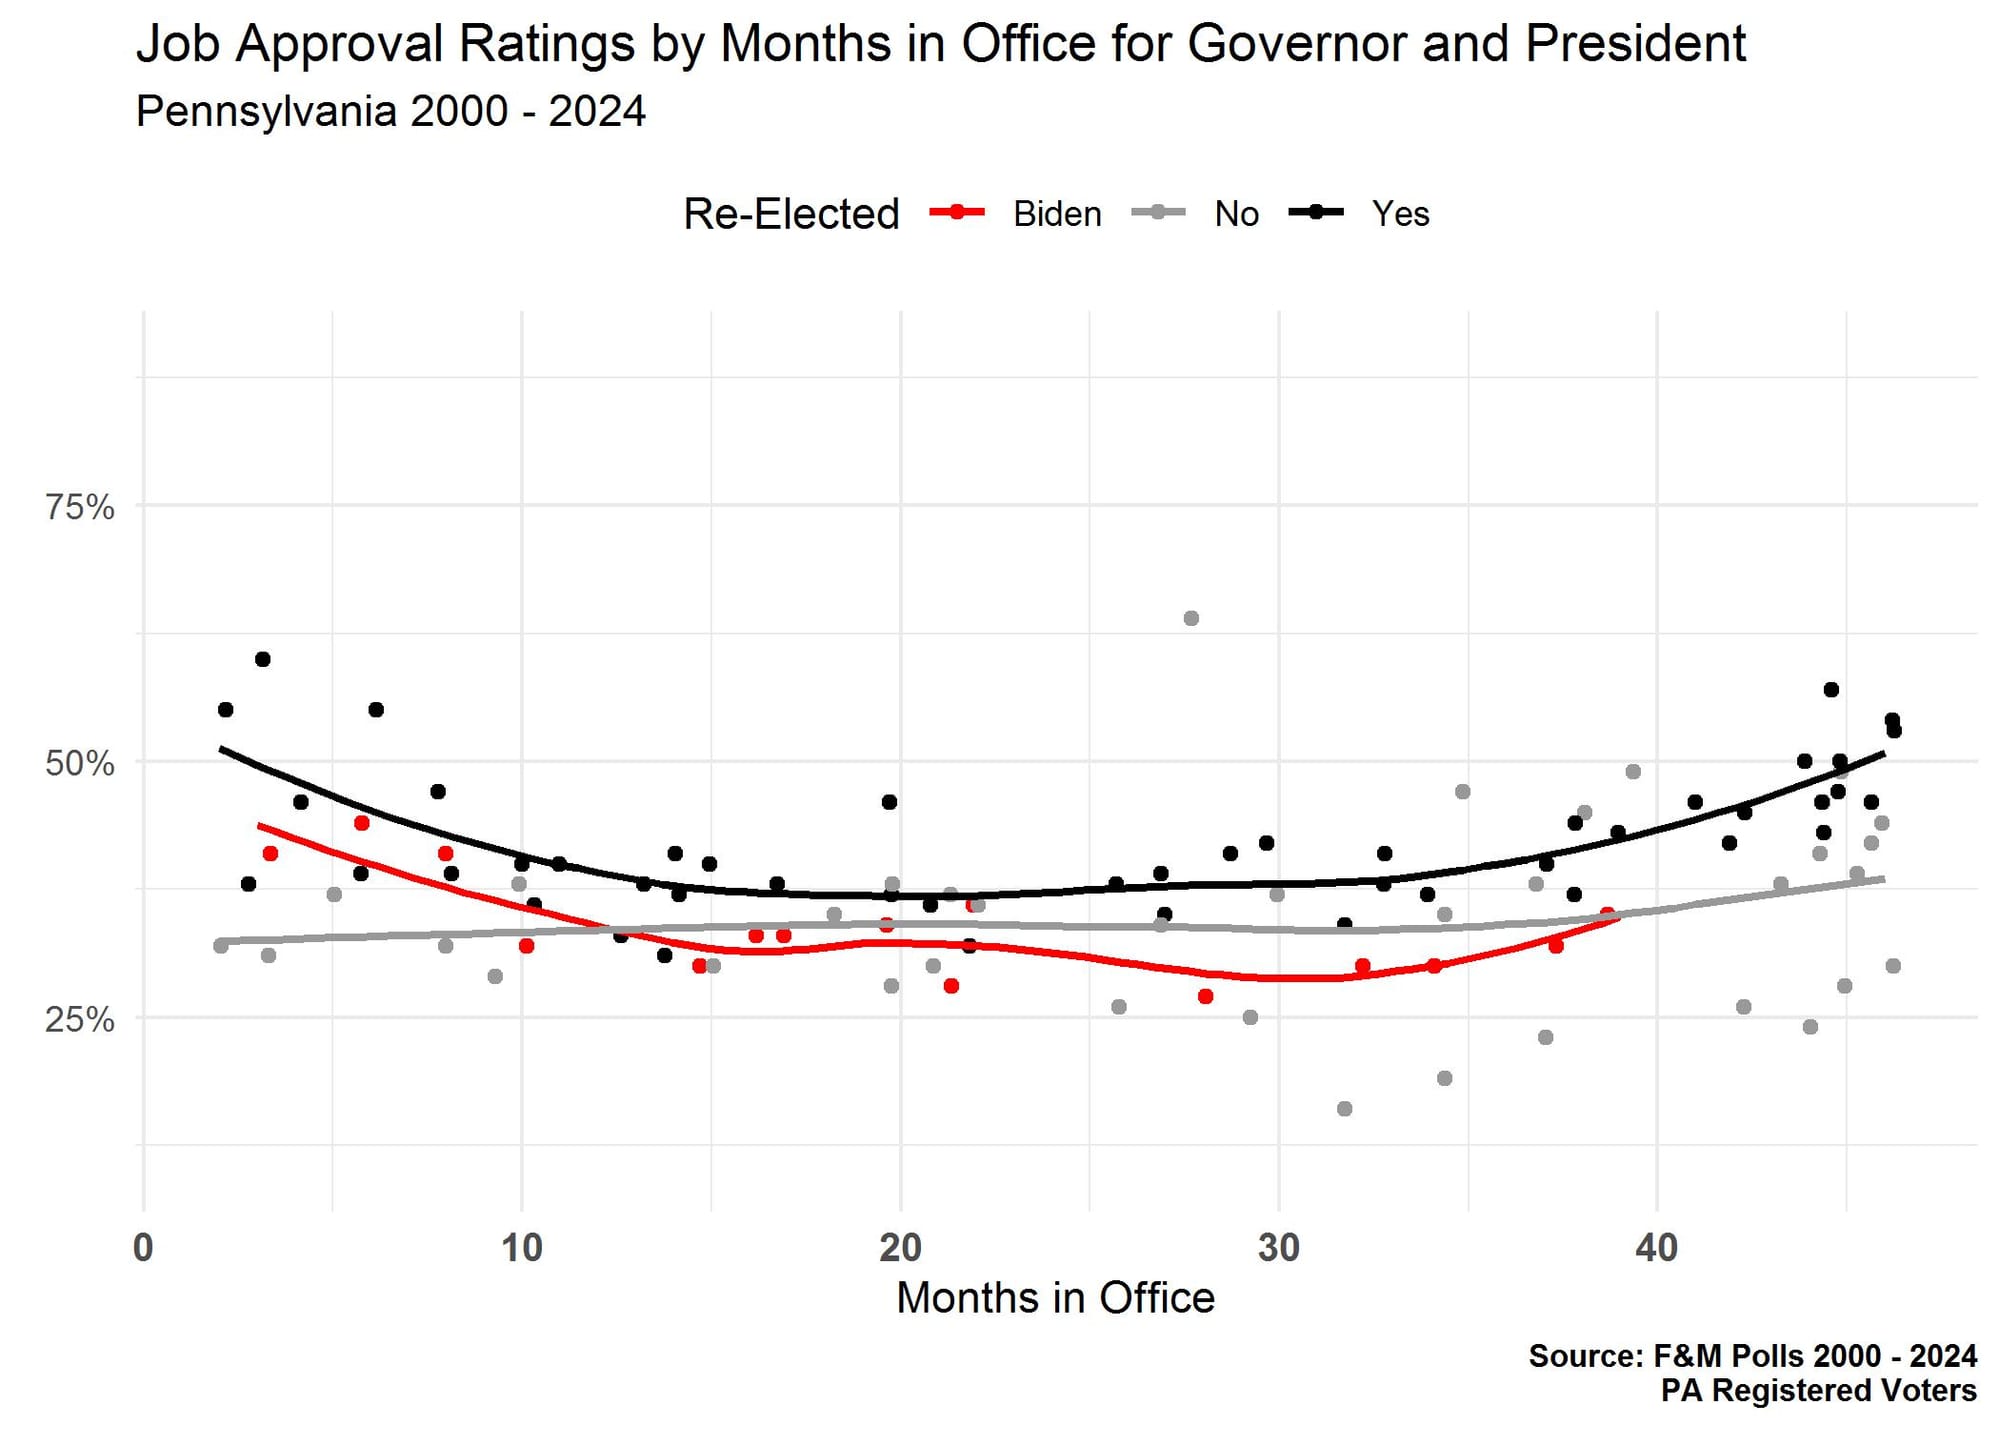
In reality, the Democrats’ theory was more magical thinking than critical thinking considering what the polls have shown over time, starting with the way voters have judged President Biden’s performance and the stability of those judgments. As we wrote in a review of state polling last July, President Biden’s average approval rating in the state aligns him more closely with first-term incumbents who have lost than those who have won.
Figure 1 shows that President Biden’s job approval ratings remain closer to an electoral loser’s trajectory than an electoral winner’s, changing little since the end of his first year in office. What’s more, as we noted in January of this year, the president’s approval numbers saw large declines among young voters, minority voters, and progressives, with declines of more than 20 points since March 2021 among Democrats, liberals, non-whites, and residents of southeastern Pennsylvania.
In our July 2023 newsletter, we also made it clear that feelings about the president’s opponent will matter because that opponent needs to be viewed as a viable alternative. When the challenger is viewed less favorably than the incumbent, the incumbent tends to win, making a president’s approval rating only part of the story. But the president won’t find any relief from this metric, either: his net favorability rating was minus 15 in April (Table A-1), well below his plus five rating in the fall of 2020. Trump’s personal favorability hasn't changed much, so while he hasn’t won over more friends in the state, he hasn't lost many either.
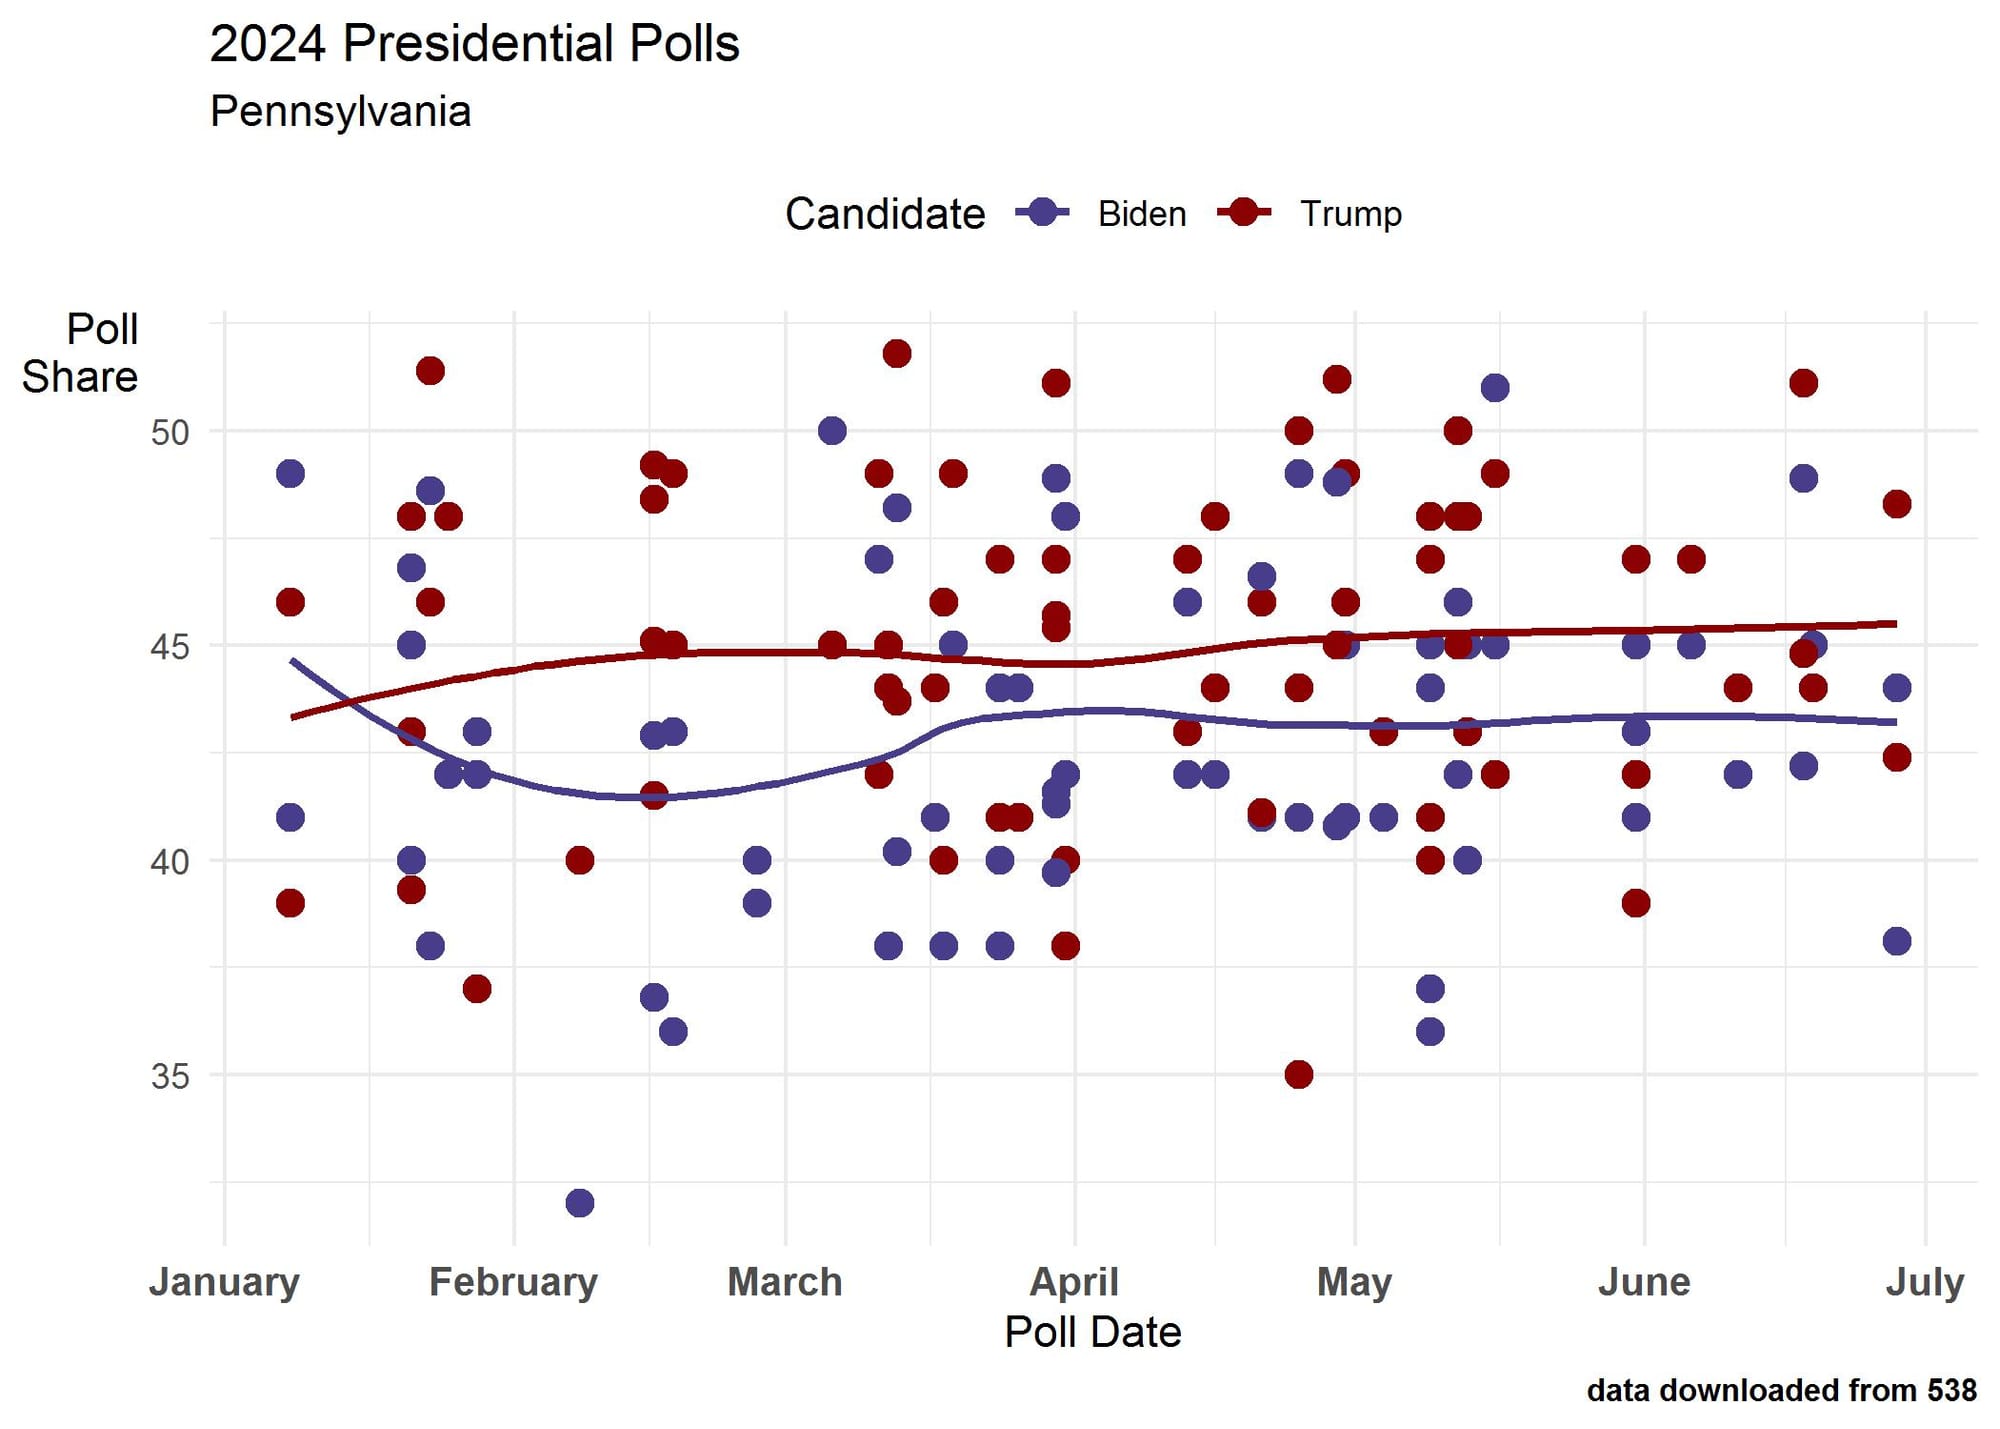
All of this leaves Donald Trump with a growing lead in the most important swing state in the nation (Figure 2). Trying to make a judgment about the president’s chances of success by relying on horse race numbers at this point isn’t wise, but neither is it wise to ignore the race’s longer-term fundamentals. Does anyone believe the president is better positioned now than he was before the debate to change its’ trajectory?
The Counterpoint: Senator Casey
Democrats should recognize that the problems confronting the president’s re-election are mainly about the incumbent and not about Democrats, the Democratic Party brand itself, or a gathering red wave that will wipe top Democrats from office. Pennsylvania’s incumbent Senator Bob Casey provides an example of the performance gap between the president and other Democrats, which is also apparent in most other swing states that have a democratic incumbent running for senate.
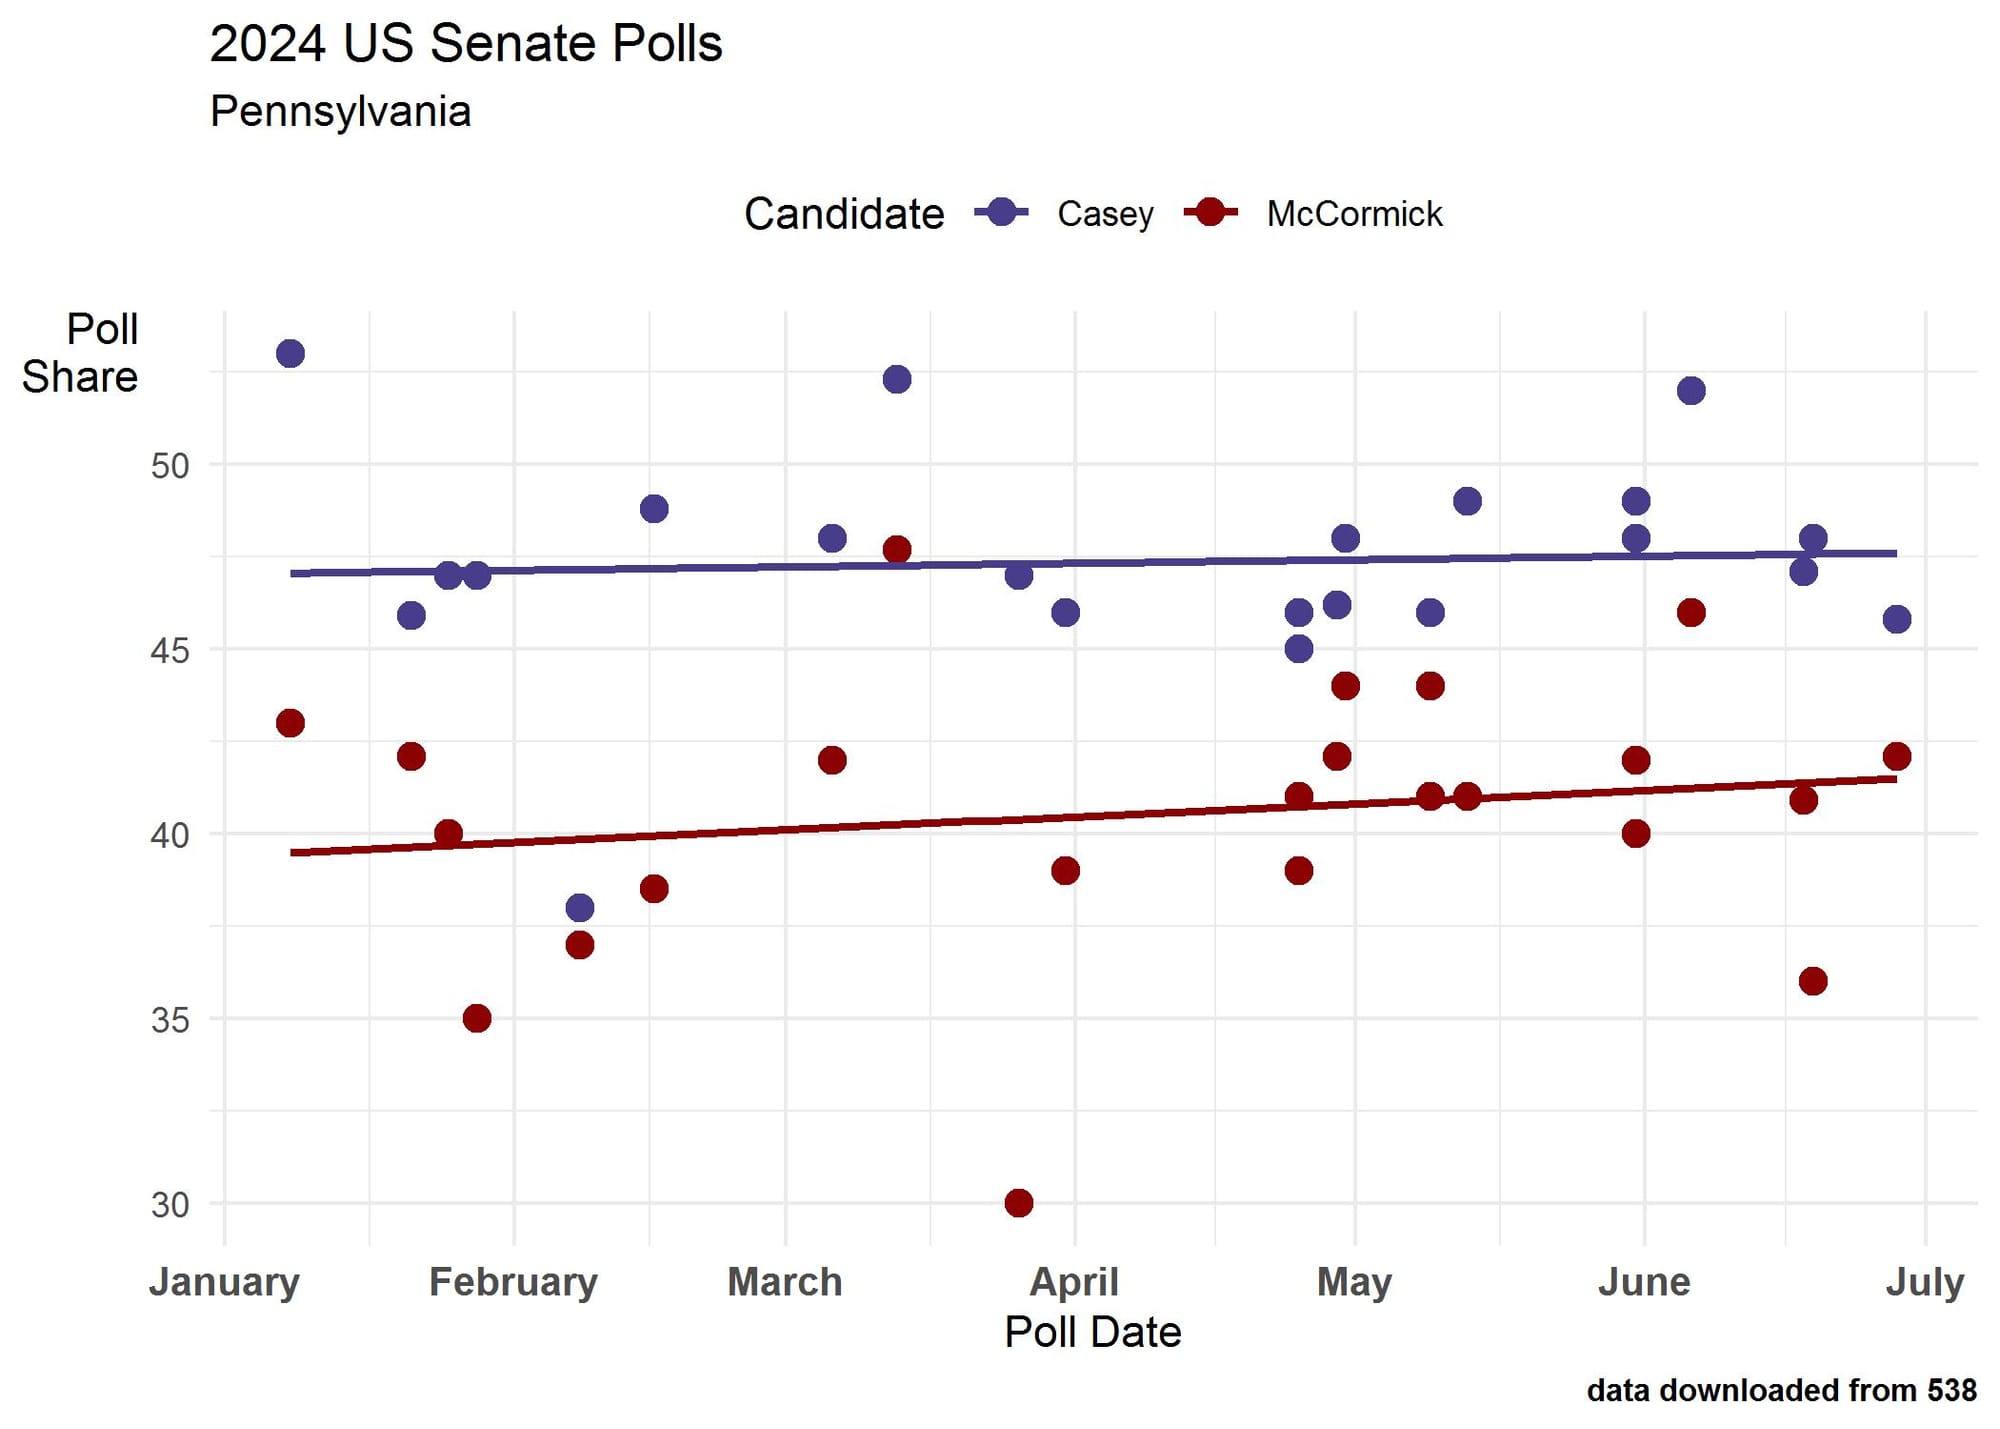
Senator Casey’s average positive approval rating since 2007 is 36% in our polling, although that tends to increase as Election Day gets closer. In October 2018, for example, his positive job approval rating was 43% and the proportion of the state’s voters who thought he was doing a “poor” job as senator was only 23%. In our last poll, Casey had a 37% positive approval and only 18% gave him a "poor" rating. Compare that to President Biden, who was seen as doing a “poor” job as president by 52% of the state’s voters in the same poll. Casey has a net positive favorable rating of plus six points compared to his opponent Dave McCormick, who has a net negative favorability rating of minus six (Table A-2). Consequently, Casey has held a consistent lead over his challenger (Figure 3).
No Risk-Free Choices
Something about the presidential campaign, either the candidate or the messaging, will need to change prior to November if Democrats plan to win Pennsylvania. We have noted before that there is a lack of excitement within the president’s base, particularly how few liberals would feel very hopeful or very happy if he won. As we said at the time, “this challenge probably requires his campaign to do more than simply tout his policy successes and proposals. He needs to find a way to emotionally connect with his base. Whether concerns about his age would be altered by such a connection is unclear, but it might be worth asking whether the lack of a positive vision about the future could be magnifying concerns about his age.”
The president’s attempts to win back and energize his base and cast his opponent as an unacceptable alternative for undecided voters have so far failed, and his debate performance seems to have made his base less enthusiastic about his candidacy. The Democrats’ path forward is full of risks if the president is replaced, but hoping that polarization and abortion rights will bring voters home to Democrats on Election Day is a risk, too.
Attachments
Table A-1. Favorability Ratings of Presidential Candidates in Pennsylvania, 2000 - 2024
|
Year |
Candidate |
Party |
Net Favorable Spring |
Net Favorable Fall |
|
2000 |
George W. Bush |
Rep |
4 |
7 |
|
2000 |
Al Gore |
Dem |
7 |
8 |
|
2004 |
George W. Bush |
Rep |
3 |
-7 |
|
2004 |
John Kerry |
Dem |
4 |
11 |
|
2008 |
John McCain |
Rep |
12 |
5 |
|
2008 |
Barack Obama |
Dem |
10 |
20 |
|
2012 |
Mitt Romney |
Rep |
-19 |
-4 |
|
2012 |
Barack Obama |
Dem |
3 |
4 |
|
2016 |
Donald Trump |
Rep |
-36 |
-27 |
|
2016 |
Hilary Clinton |
Dem |
-11 |
-6 |
|
2020 |
Donald Trump |
Rep |
-14 |
-15 |
|
2020 |
Joe Biden |
Dem |
0 |
5 |
|
2024 |
Donald Trump |
Rep |
-21 |
|
|
2024 |
Joe Biden |
Dem |
-15 |
Table A-2. Favorability Ratings of U.S. Senate Candidates in Pennsylvania, 1998 - 2024
|
Year |
Candidate |
Party |
Net Favorable Spring |
Net Favorable Fall |
|
1998 |
Arlen Specter |
Rep |
35 |
47 |
|
1998 |
William Lloyd, Jr. |
Dem |
3 |
5 |
|
2000 |
Rick Santorum |
Rep |
20 |
18 |
|
2000 |
Ron Klink |
Dem |
8 |
-4 |
|
2004 |
Arlen Specter |
Rep |
16 |
17 |
|
2004 |
Joe Hoeffel |
Dem |
2 |
6 |
|
2006 |
Rick Santorum |
Rep |
5 |
-10 |
|
2006 |
Bob Casey, Jr. |
Dem |
15 |
10 |
|
2010 |
Pat Toomey |
Rep |
8 |
4 |
|
2010 |
Joe Sestak |
Dem |
5 |
-11 |
|
2012 |
Tom Smith |
Rep |
1 |
0 |
|
2012 |
Bob Casey, Jr. |
Dem |
20 |
5 |
|
2016 |
Pat Toomey |
Rep |
-4 |
-17 |
|
2016 |
Katie McGinty |
Dem |
0 |
1 |
|
2018 |
Bob Casey, Jr. |
Dem |
21 |
17 |
|
2018 |
Lou Barletta |
Rep |
-3 |
-6 |
|
2022 |
Mehmet Oz |
Rep |
-30 |
-19 |
|
2022 |
John Fetterman |
Dem |
7 |
-8 |
|
2024 |
Bob Casey, Jr. |
Dem |
6 |
|
|
2024 |
Dave McCormick |
Rep |
-6 |
Franklin & Marshall College Poll Newsletter
Join the newsletter to receive the latest updates in your inbox.