
Franklin & Marshall Poll Release: August 2024
This month's poll shows Pennsylvania voters' opinions on the 2024 presidential and U.S. Senate races, cell phones in schools, voting reform, and the legal definition of marriage.
Dear Readers,
I'm writing to share our summary report for the August 2024 Franklin & Marshall College Poll. I've highlighted a few of the key findings below, but I encourage you to read the full report, which is also included. The full report includes cross-tab tables as attachments for the presidential and senate matchups and a new section that answers questions I've received from some of you about our polling methodology (see page 12 of the Summary Report). The Poll explores the mood of the state’s voters, their positions on issues like cell phones in schools, voting reforms, and redefining the legal definition of marriage, and their ratings of state political figures and the presidential candidates.
Thank you for reading,
Berwood Yost
Key Findings
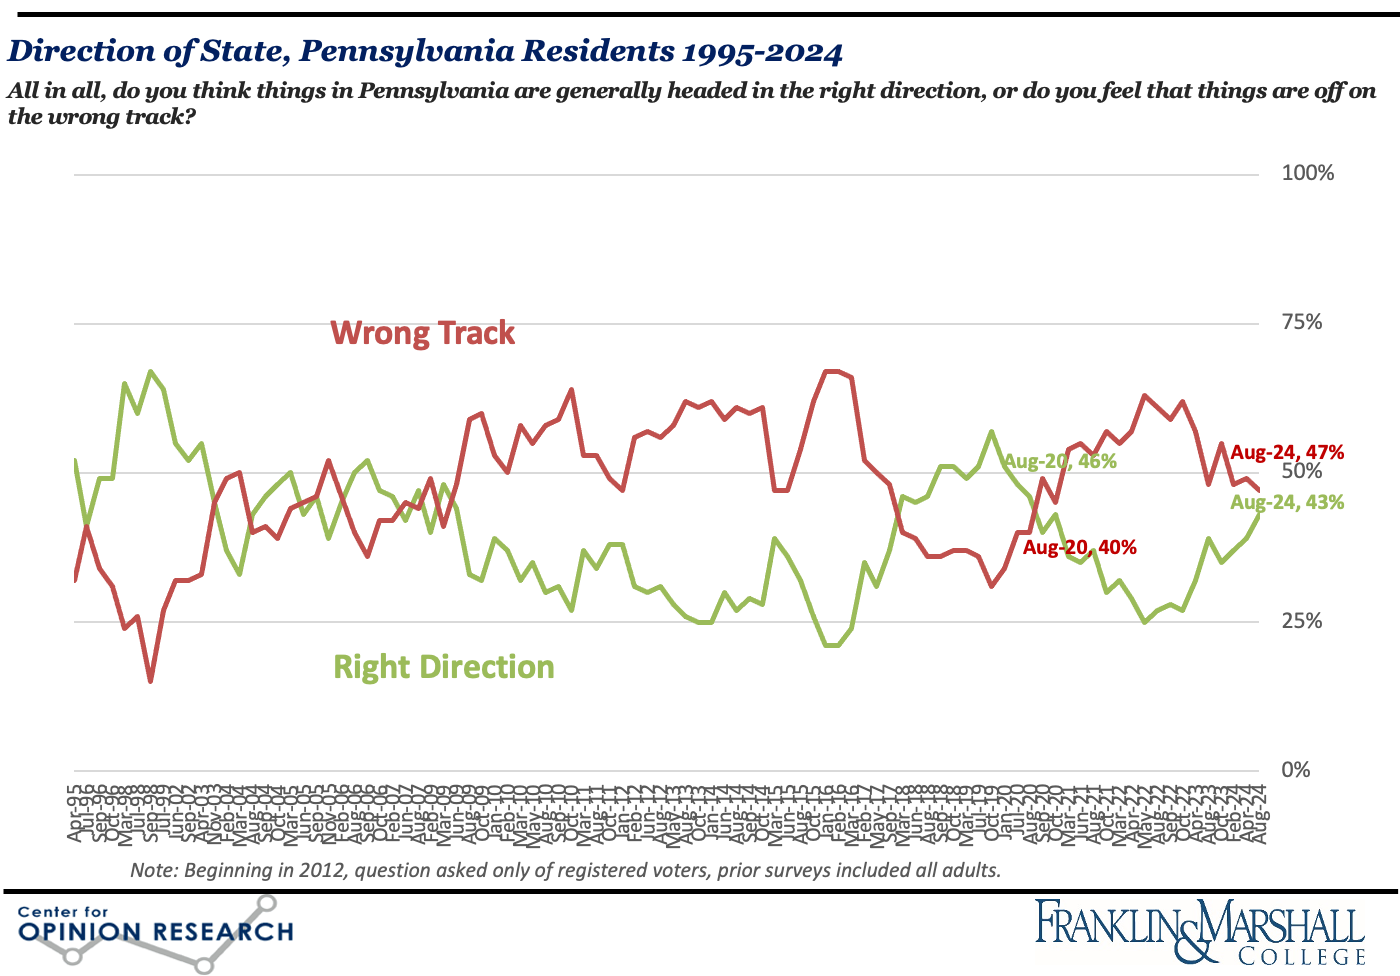
The August 2024 Franklin & Marshall College Poll finds that concern about the economy (31%), including unemployment and higher gas and utility prices, continues as the most often mentioned problem facing the state, according to the state’s registered voters. Half (47%) of respondents say they are “worse off” than a year ago, which is similar to how respondents felt much of the past several years. One in five (20%) registered voters expects they will be “worse off” financially a year from now, which is less than the one in three (35%) who said so in October 2023 and is lower than at any time since March 2021. Pennsylvania voters are more pessimistic than optimistic about conditions in the state with about half (47%) reporting the state is “off on the wrong track,” but two in five (43%) believes things are “headed in the right direction,” which is the highest proportion since October 2020.
The survey also includes notable findings about state-level issues on cell phones in schools, open primary elections, legal changes to the definition of marriage, and Sunday hunting:
- More than four in five (84%) registered voters believes that schools should be allowed to limit students’ access to cell phones during the school day.
- Three in four (77%) registered voters favors open primary elections that allow registered independent voters to participate in the primary election of their choice. Nearly a third (31%) of voters said that allowing independents to vote in open primaries would make them likely to change their party registration.
- The state house of representatives passed a bill to revise Pennsylvania law so that marriage is defined as a civil contract between two individuals, replacing the current language that defines marriage as a civil contract between a man and a woman. Three in five (59%) registered voters favors redefining the legal definition of marriage, although more Democrats (86%) and independents (59%) than Republicans (31%) support this proposal.
- More registered voters support (49%) than oppose (34%) allowing hunting to take place on Sundays during hunting season, although there is a sizable group of people (16%) who are unsure about whether Sunday hunting should be allowed. More Republicans (59%) and independents (50%) than Democrats (40%) support Sunday hunting.
Shapiro Job Approval Rating
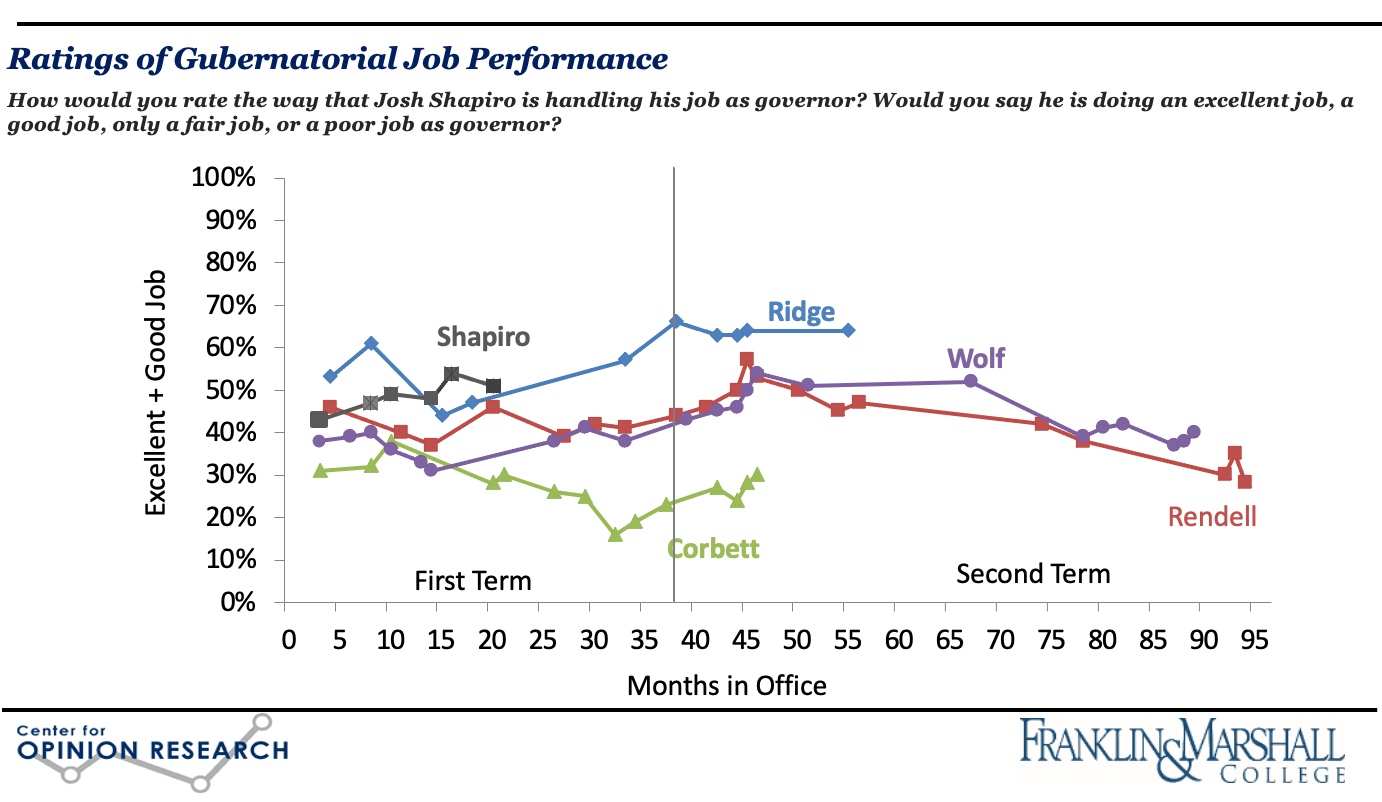
Governor Shapiro’s job approval ratings remain high: more than one in two (52%) registered voters believes he is doing an “excellent” or “good” job as governor. He has the highest approval rating for a governor at this point in a first term since Governor Ridge.
Presidential Politics
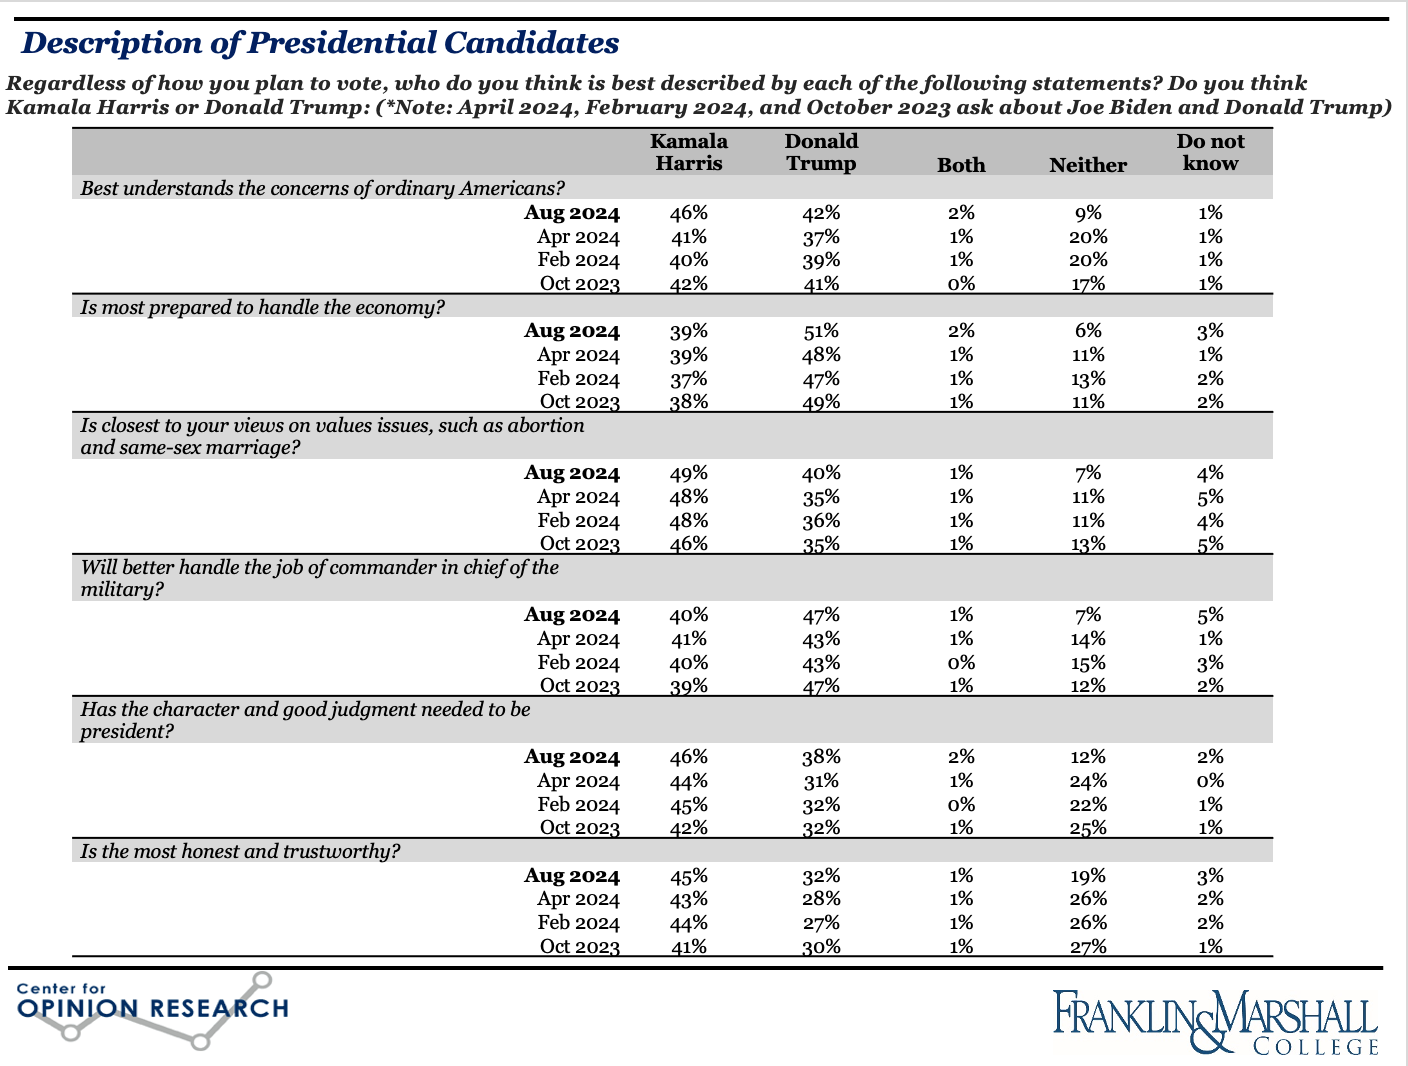
Vice President Harris leads Donald Trump in Pennsylvania, 46% to 43%. The main reasons that Harris voters are supporting her candidacy include anti-Trumpism (18%), women’s rights (17%), character (15%), partisanship (13%), and democracy (13%). The top reasons voters provide for supporting Trump include economic policy (29%), immigration (20%), and partisanship (19%). More voters believe Vice President Harris has better judgment, is more trustworthy, and is closer to their views on values issues than Mr. Trump, while more voters believe Mr. Trump is better able to handle the economy (Figure 3).
U.S. Senate
About two in five (38%) registered voters in Pennsylvania believes Bob Casey is doing an “excellent” or “good” job as their U.S. senator. Senator Casey is viewed more favorably (43%) than unfavorably (36%) by the state’s registered voters. David McCormick is viewed more unfavorably (37%) than favorably (31%) by the state’s voters, although about one in three (32%) do not know enough about him to express an opinion.
Senator Casey leads Republican David McCormick 48% to 36% in a head-to-head matchup for U.S. Senate. Casey maintains a larger share of his base than McCormick; nearly nine in ten (90%) Democrats support him, but McCormick currently holds only 3 in 4 Republicans (73%). Voters who support Senator Casey most often mention partisanship (31%), honesty (10%), women’s rights (10%), his experience (7%), and his residency in the state (7%) as the reasons they are voting for him. McCormick’s supporters mention partisanship (37%), economic policy (18%), honesty (9%), and immigration (6%) as the reasons they support him.
Methodology
The survey findings presented in this release are based on the results of interviews conducted July 31 – August 11, 2024. The interviews were conducted at the Center for Opinion Research at Franklin & Marshall College. The data included in this release represent the responses of 920 registered Pennsylvania voters, including 411 Democrats, 378 Republicans, and 131 Independents.[1] The sample of voters was obtained from Aristotle. All sampled respondents were notified by mail about the survey. Interviews were completed over the phone and online depending on each respondent’s preference. Survey results were weighted (age, gender, education, geography, vote history, and party registration) using an iterative weighting algorithm to reflect the known distribution of those characteristics. Estimates for age, geography, and party registration are based on active voters within the Pennsylvania Department of State’s voter registration data. Gender and education are estimated using data from the November 2022 CPS Voter Registration Supplement.
The sample error for this survey is +/- 3.8 percentage points when the design effects from weighting are considered. The sample error for questions based on subgroups is larger. In addition to sampling error, this poll is also subject to other sources of non-sampling error. Generally speaking, two sources of error concern researchers most. Non-response bias is created when selected participants either choose not to participate in the survey or are unavailable for interviewing. Response errors are the product of the question and answer process. Surveys that rely on self-reported behaviors and attitudes are susceptible to biases related to the way respondents process and respond to survey questions.
[1] The data reported here is voter REGISTRATION and is consistent with past reporting practices. The survey also asked about self-reported voter IDENTIFICATION, which shows a slightly different partisan split: 45% identify as Republican (n=400), 8% as Independent (n=68), and 45% as Democrat (n=394) and the balance not offering a response. Partisan comparisons in this summary show self-reported registration.
Franklin & Marshall College Poll Newsletter
Join the newsletter to receive the latest updates in your inbox.