
Franklin & Marshall Poll Release: October 2024
Both the presidential and senate races in Pennsylvania are neck-and-neck among likely voters in this month's poll, which also explores voters' positions on a number of campaign issues, including immigration, the economy, fracking, and abortion rights.
Dear Readers,
I’m writing to share our summary report for the October 2024 Franklin & Marshall College Poll. I've highlighted a few of the key findings below, but I encourage you to read the full report, which is also included. The full report includes cross-tab tables as attachments for the presidential and senate matchups. The Poll explores the mood of the state’s voters and their positions on a number of issues that have been discussed by the presidential campaigns—including immigration, fracking, and abortion rights—in addition to their ratings of state political figures and the presidential candidates.
Thank you for reading,
Berwood Yost
Key Findings
The October 2024 Franklin & Marshall College Poll finds that the state’s current electoral environment seems to offer more advantages for Republicans than Democrats. Two in five (43%) respondents say they are “worse off” financially than a year ago, meaning voters are much less optimistic about their personal financial circumstances today than they were at the time of the last presidential election in October 2020 (Figure 1). Pennsylvania voters are also more pessimistic than optimistic about conditions in the state with about half (48%) reporting the state is “off on the wrong track.” President Biden continues to receive low marks as president, with only one in three (34%) voters rating his performance as “excellent” or “good.” Concern about the economy (35%), including unemployment and higher gas and utility prices, continues as the most important and often mentioned problem facing the state.
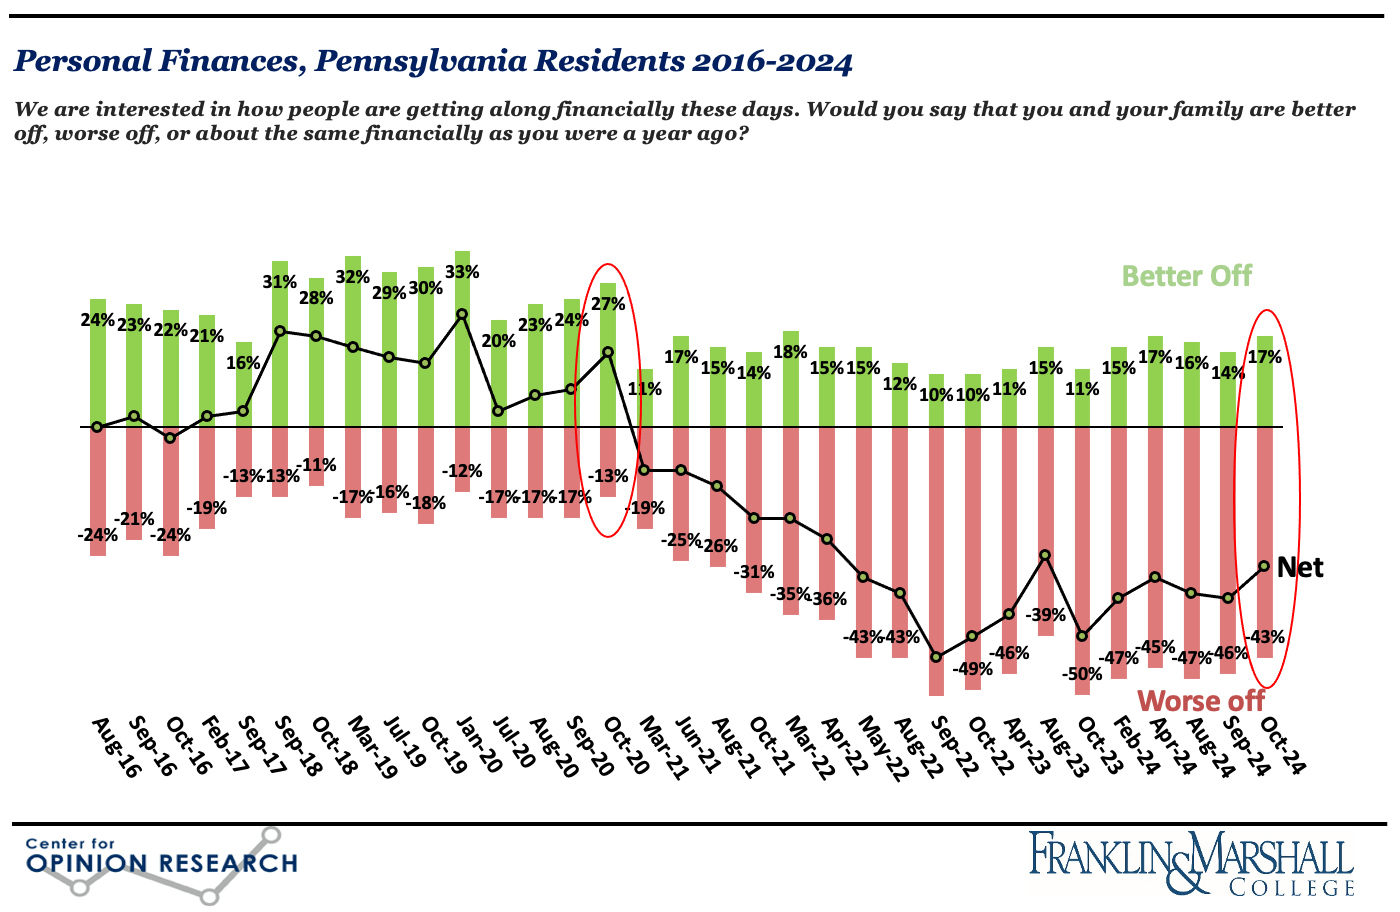
Table 1 compares a number of polling indicators in October of recent presidential elections. The sizable negative gaps in presidential job approval ratings and personal financial condition continue to provide major headwinds for democratic candidates. Former President Trump’s improved favorability ratings, though still negative, are a benefit for Republicans compared to his favorability ratings in 2016. The only advantage Democrats appear to have is that they lead in the congressional generic ballot by a single point, but even this may be misleading: 9% of voters are undecided about their congressional vote, which means the Democratic advantage could vanish if partisan feelings run consistently up and down the ballot.
Table 1. Selected October Polling Indicators in Pennsylvania for Presidential Election Years
|
Indicator |
2004 |
2008 |
2012 |
2016 |
2020 |
2024 |
|
Net
Favorable, |
7 |
20 |
5 |
-6 |
5 |
-1 |
|
Net
Favorable, |
-3 |
5 |
-7 |
-27 |
-15 |
-12 |
|
Net
Positive Presidential Job Approval |
-12 |
-63 |
-7 |
0 |
-16 |
-31 |
|
Personal
Finances, |
- |
- |
-11 |
-2 |
14 |
-26 |
|
Very
Interested in Election |
55 |
71 |
66 |
75 |
77 |
75 |
|
Generic
Ballot, |
- |
- |
- |
5 |
6 |
1 |
|
Party
Identification, D minus R |
- |
- |
9 |
8 |
0 |
0 |
The survey also includes findings about how the state’s registered voters feel about issues that have figured prominently in this year’s presidential campaigning:
- One in five (20%) registered voters say illegal immigration has had a “very negative” impact on the community where they live. Two in five (39%) say illegal immigration has had “no impact” on their communities.
- One in five (20%) registered voters believes that fracking has helped the economy in their local community “a great deal.” Less than one in ten (7%) registered voters believes fracking has done “a great deal” of harm to the environment in the community where they live.
- Overall, more of the state’s registered voters believe natural gas drilling has done more to help the state’s economy (51%) than to harm the state’s environment (33%).
- Few (9%) of the state’s registered voters think abortion should be illegal in all circumstances. A majority (55%) believes the outcome of the presidential election will affect whether abortion is banned or severely limited in the state.
Likely Voters
The presidential and US Senate races show both are a toss-up among likely voters at this point in the race. Mr. Trump has a one-point advantage over Vice President Harris, 50% to 49%, and Senator Casey has a single-point lead over Mr. McCormick, 49% to 48%, among likely voters.[1] The difference in preferences among likely voters and registered voters, described below, is primarily because the partisan, ideological, and age profile of these voters is different–the current pool of registered voters is more Republican in terms of their party identity, has fewer moderates ideologically, and has fewer voters less than 35 years of age.
Registered Voters
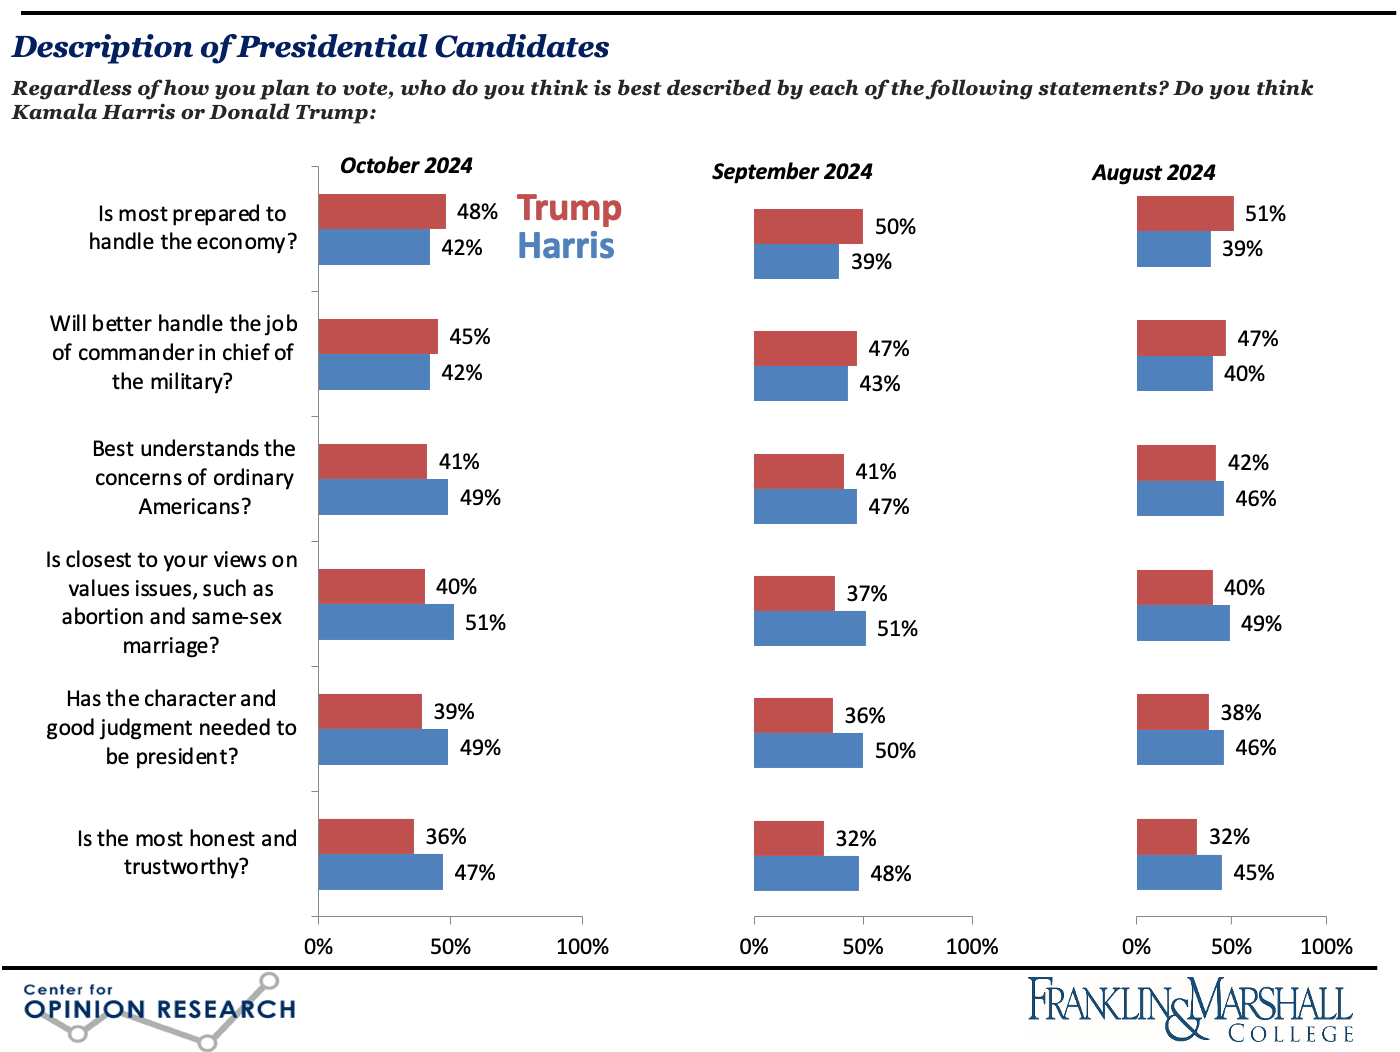
The races for president and US Senate show narrow advantages for the Democratic candidates among all registered voters. Vice President Harris leads Donald Trump, 48% to 44%, among all registered voters. More voters believe Vice President Harris has better judgment, is more trustworthy, and is closer to their views on values issues than Mr. Trump, while more voters believe Mr. Trump is better able to handle the economy, although his advantage on this issue has declined since our prior survey (Figure 2). Senator Casey leads Republican David McCormick 49% to 42% among registered voters. McCormick has increased his support among Republicans since September, rising from only three in four (75%) to nearly nine in ten (86%). About two in five (39%) registered voters in Pennsylvania believes Bob Casey is doing an “excellent” or “good” job as their US senator.
Split Ticket Voting
Few of Pennsylvania’s registered voters are splitting their tickets in the presidential and US Senate races (see Table 2). Nearly half (49%) of the registered voters are Harris-Casey voters and two in five (43%) are Trump-McCormick voters, both increases in straight-ticket voting since September. There are a small proportion of Trump-Casey (1%) and Trump-Other (1%) voters and virtually no Harris-McCormick or Harris-Other voters. Polarization is even stronger among likely voters: 49% of likely voters are Harris-Casey voters and 48% are Trump-McCormick voters at this time.
Table 2. Share of Pennsylvania Voters by Presidential and US Senate Preferences, October 2024
|
|
Presidential |
Preference |
|
Senate Preference |
Harris (Sept) |
Trump (Sept) |
|
Casey |
49% (47%) |
1% (2%) |
|
McCormick |
- |
43% (39%) |
|
Other |
- |
1% (2%) |
|
Undecided |
1% (2%) |
1% (3%) |
Note: A dash indicates less than 1% in this group.
Methodology
The survey findings presented in this release are based on the results of interviews conducted October 9 – 20, 2024. The interviews were conducted at the Center for Opinion Research at Franklin & Marshall College. The data included in this release represent the responses of 794 registered Pennsylvania voters, including 351 Democrats, 326 Republicans, and 118 Independents.[2] The sample of voters was obtained from Aristotle. All sampled respondents were notified by mail about the survey. Interviews were completed over the phone and online depending on each respondent’s preference. Survey results were weighted (age, gender, education, geography, vote history, and party registration) using an iterative weighting algorithm to reflect the known distribution of those characteristics. Estimates for age, geography, and party registration are based on active voters within the Pennsylvania Department of State’s voter registration data. Gender and education are estimated using data from the November 2022 CPS Voter Registration Supplement.
The sample error for this survey is +/- 4.3 percentage points when the design effects from weighting are considered. The sample error for questions based on subgroups is larger. The survey also highlights the responses of likely voters, defined as those registered voters who report being “certain” to vote and being “very interested” in the political campaign (n=583). The sample error for likely voters is +/- 5.0 percentage points. In addition to sampling error, this poll is also subject to other sources of non-sampling error. Generally speaking, two sources of error concern researchers most. Non-response bias is created when selected participants either choose not to participate in the survey or are unavailable for interviewing. Response errors are the product of the question and answer process. Surveys that rely on self-reported behaviors and attitudes are susceptible to biases related to the way respondents process and respond to survey questions.
[1] Mr. Trump’s lead among likely voters is actually less than one point. The unrounded values for the presidential race are Trump 49.6% and Harris 49.3%.
[2] The data reported here is voter REGISTRATION and is consistent with past reporting practices. The survey also asked about self-reported voter IDENTIFICATION, which shows a slightly different partisan split: 45% identify as Republican (n=350), 7% as independent (n=57), and 45% as Democrat (n=351) and the balance not offering a response. Partisan comparisons in this summary show self-reported registration.
Franklin & Marshall College Poll Newsletter
Join the newsletter to receive the latest updates in your inbox.