
Franklin & Marshall Poll Release: September 2024
This month’s poll of Pennsylvania registered voters finds that Kamala Harris leads Donald Trump 49% - 46% in the presidential race. The poll also explores opinions on the economy, the direction of the state, and US foreign policy.
Dear Readers,
I’m writing to share our summary report for the September 2024 Franklin & Marshall College Poll. I've highlighted a few of the key findings below, but I encourage you to read the full report, which is also included. The full report includes cross-tab tables as attachments for the presidential and senate matchups. The Poll explores the mood of the state’s voters and their positions on a number of foreign policy issues—including the United States’ involvement in world affairs, support for Ukraine, and immigration—in addition to their ratings of state political figures and the presidential candidates.
Thank you for reading,
Berwood Yost
Key Findings
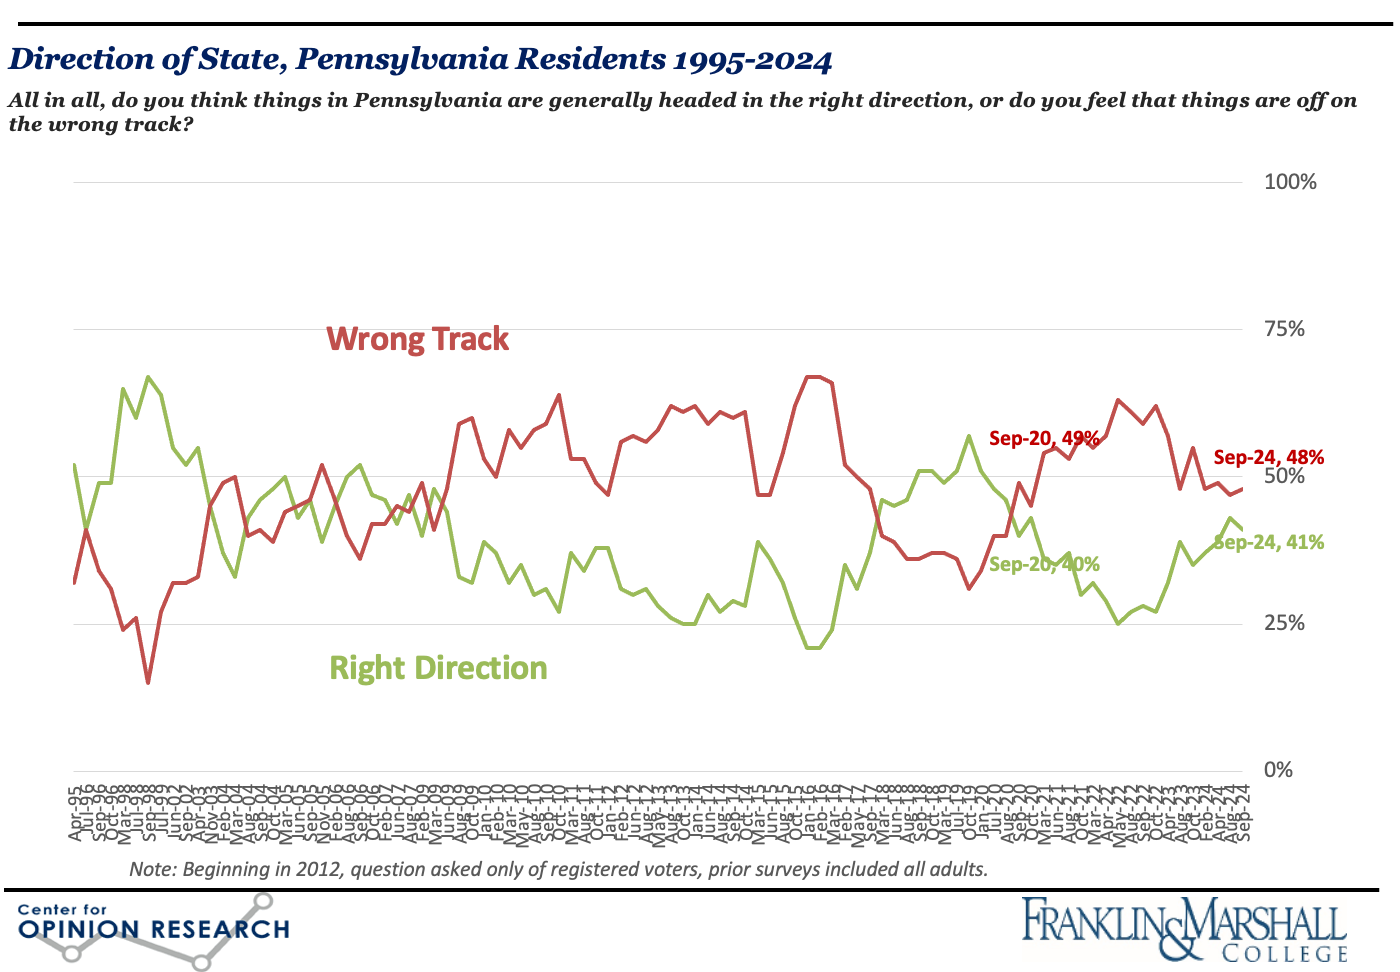
The September 2024 Franklin & Marshall College Poll finds that concern about the economy (34%), including unemployment and higher gas and utility prices, continues as the most often mentioned problem facing the state, according to the state’s registered voters. Half (46%) of respondents say they are “worse off” than a year ago, which is similar to how respondents have felt for most of the past several years. One in seven (15%) registered voters expects they will be “worse off” financially a year from now, which is less than the one in five (20%) who said so in August and is the lowest reported number since March 2021. Pennsylvania voters are more pessimistic than optimistic about conditions in the state with about half (48%) reporting the state is “off on the wrong track.” Still, two in five (41%) believes things are “headed in the right direction,” which is similar to last month and the highest proportion since October 2020.
The survey also includes notable findings about foreign policy issues:
- More of the state’s registered voters believe that the United States should be less active in world affairs (37%) than more active (16%), although a plurality (41%) believes it should maintain its current level of activity.
- Pennsylvania’s registered voters are equally divided about providing development and humanitarian aid to the Palestinians. One in three (32%) says the United States is providing too much aid and one in three (31%) says the United States is not providing enough aid.
- More of the state’s registered voters believe the United States is providing too much (45%) rather than not enough (20%) economic and military aid to Israel.
- Three in five (61%) registered voters in Pennsylvania believes that the United States should provide more or the same amount of military support for Ukraine. One in five believes the United States should provide less military support (19%) to Ukraine and one in seven (15%) wants all military aid withdrawn.
- A plurality (48%) of registered voters thinks the United States should devote more resources to controlling immigration at the border, while one in four (26%) believes the United States should devote more resources to addressing the issues that cause migration and one in five (21%) believes it should do both.
Presidential Politics
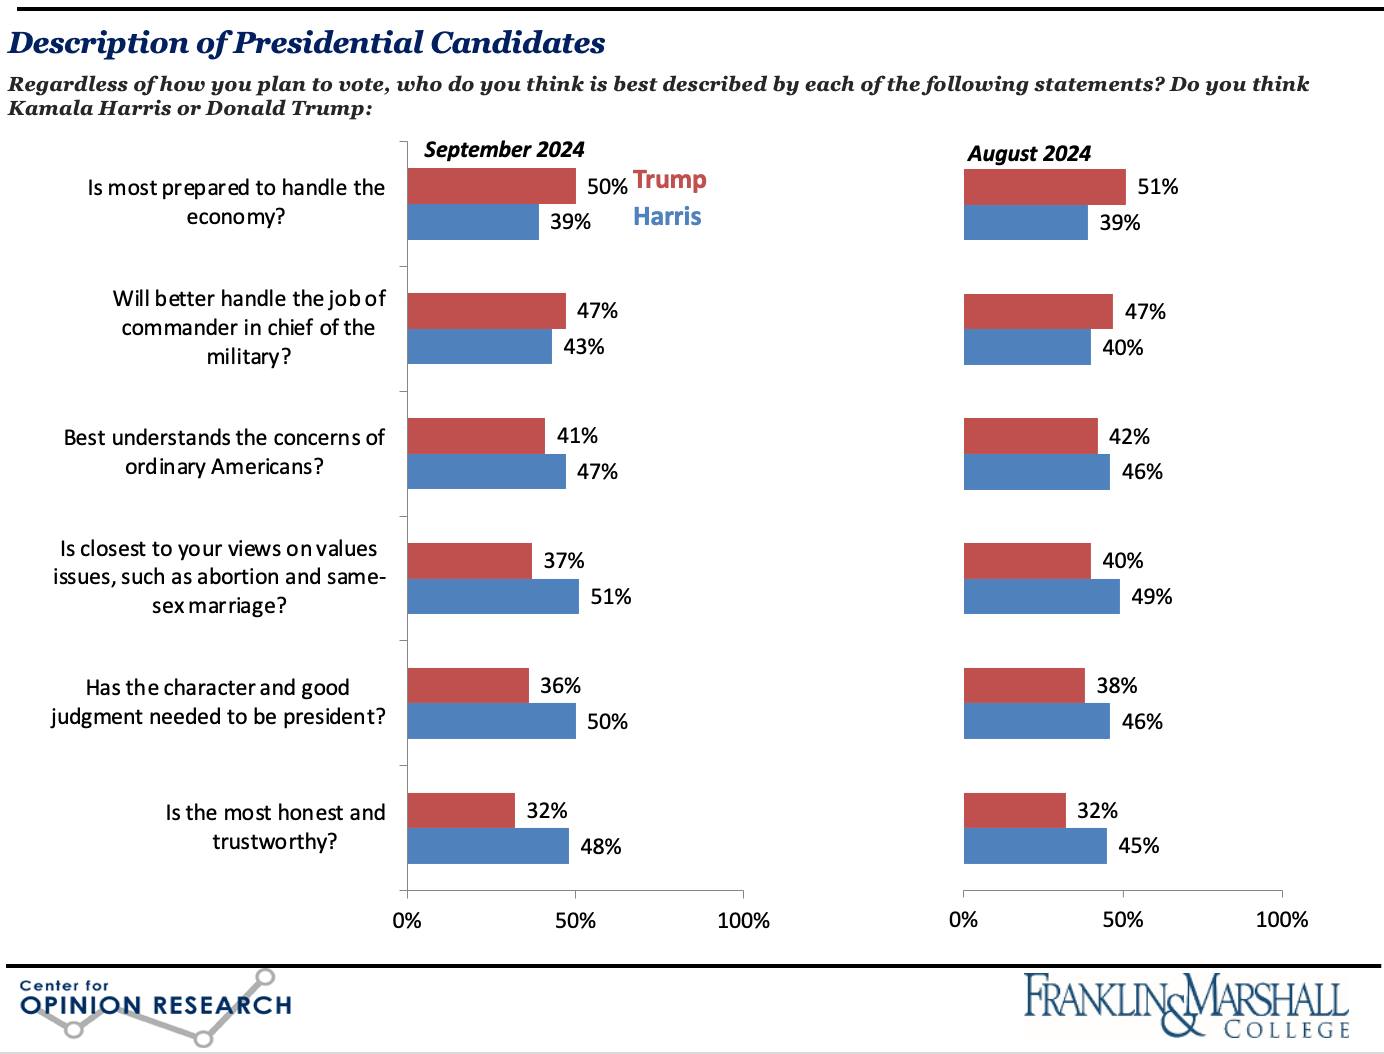
Vice President Harris leads Donald Trump in Pennsylvania, 49% to 46%, in a multi-candidate race with third party candidates and leaning voters included. Supporters of the major party candidates are equally enthusiastic about their respective candidates: three in five supporters of each candidate are “very enthusiastic” about supporting them. Turnout is undoubtedly a key variable in this race and the balance of regular and less frequent voters will be determinative: Harris leads among those who regularly vote, 51% to 47%, but Trump has an advantage among less frequent voters, 47% to 46%. More voters believe Vice President Harris has better judgment, is more trustworthy, and is closer to their views on values issues than Mr. Trump, while more voters believe Mr. Trump is better able to handle the economy.
Presidential Dashboard
Table 1 compares a number of polling indicators in September of the last five presidential elections. The sizable negative gaps in presidential job approval ratings and personal financial condition continue to provide major headwinds for democratic candidates. Former President Trump’s improved favorability ratings, though still negative, are a benefit for Republicans compared to his favorability ratings in 2016. The only advantage Democrats appear to have is that they lead in the congressional generic ballot by five points, but even this may be misleading: 12% of voters are undecided about their congressional vote, which means the Democratic advantage could vanish if partisan feelings run consistently up and down the ballot.
Table 1. Selected September Polling Indicators for Presidential Election Years
|
Indicator |
2004 |
2008 |
2012 |
2016 |
2020 |
2024 |
|
Net Favorable, |
-1 |
19 |
8 |
-3 |
2 |
-3 |
|
Net Favorable, |
2 |
12 |
-19 |
-28 |
-17 |
-9 |
|
Net Positive
Presidential Job Approval |
-2 |
-67 |
-5 |
3 |
-22 |
-28 |
|
Personal Finances, |
- |
-28 |
-10 |
2 |
7 |
-32 |
|
Very Interested in
Election |
55 |
71 |
66 |
76 |
71 |
72 |
|
Generic Ballot, |
6 |
5 |
||||
|
Party Identification,
D minus R |
|
|
|
|
4 |
0 |
US Senate
Senator Casey leads Republican David McCormick 48% to 40% in a head-to-head matchup for US Senate, which is narrower than the advantage he held over McCormick in most of our prior polls. About two in five (37%) registered voters in Pennsylvania believes Bob Casey is doing an “excellent” or “good” job as their US senator. Senator Casey is viewed more favorably (41%) than unfavorably (39%) by the state’s registered voters. David McCormick is viewed more unfavorably (44%) than favorably (30%) by the state’s voters, although about one in four (26%) do not know enough about him to express an opinion. McCormick’s unfavorability ratings have grown more than his favorability ratings during the course of the campaign so far.
Split Ticket Voting
Few Pennsylvania voters are splitting their tickets in the presidential and US senate races (see Table 2). Nearly half (47%) of the voters are Harris-Casey voters and two in five (39%) are Trump-McCormick voters. There are a small proportion of Trump-Casey (2%) and Trump-Other (2%) voters and virtually no Harris-McCormick or Harris-Other voters.
Table 2. Share of Pennsylvania Voters by Presidential and US Senate Preferences
|
Senate Preference |
Harris |
Trump |
Other |
Undecided |
|
Casey |
47% |
2% |
1% |
- |
|
McCormick |
- |
39% |
1% |
- |
|
Other |
- |
2% |
- |
- |
|
Undecided |
2% |
3% |
1% |
1% |
Note: A dash indicates less than 1% in this group.
Methodology
The survey findings presented in this release are based on the results of interviews conducted September 4 –15, 2024. The interviews were conducted at the Center for Opinion Research at Franklin & Marshall College. The data included in this release represent the responses of 890 registered Pennsylvania voters, including 399 Democrats, 366 Republicans, and 125 Independents.[1] One quarter (n=278) of the interviewing was conducted after the September 10th debate. The sample of voters was obtained from Aristotle. All sampled respondents were notified by mail about the survey. Interviews were completed over the phone and online depending on each respondent’s preference. Survey results were weighted (age, gender, education, geography, vote history, and party registration) using an iterative weighting algorithm to reflect the known distribution of those characteristics. Estimates for age, geography, and party registration are based on active voters within the Pennsylvania Department of State’s voter registration data. Gender and education are estimated using data from the November 2022 CPS Voter Registration Supplement.
The sample error for this survey is +/- 4.1 percentage points when the design effects from weighting are considered. The sample error for questions based on subgroups is larger. In addition to sampling error, this poll is also subject to other sources of non-sampling error. Generally speaking, two sources of error concern researchers most. Non-response bias is created when selected participants either choose not to participate in the survey or are unavailable for interviewing. Response errors are the product of the question and answer process. Surveys that rely on self-reported behaviors and attitudes are susceptible to biases related to the way respondents process and respond to survey questions.
[1] The data reported here is voter REGISTRATION and is consistent with past reporting practices. The survey also asked about self-reported voter IDENTIFICATION, which shows a slightly different partisan split: 44% identify as Republican (n=381), 10% as independent (n=83), and 44% as Democrat (n=383) and the balance not offering a response. Partisan comparisons in this summary show self-reported registration.
Franklin & Marshall College Poll Newsletter
Join the newsletter to receive the latest updates in your inbox.