More of the Same: What the 2024 Election Results Tell us about Pennsylvania
Democrats experienced a deep loss in Pennsylvania in 2024. But does this mean the state--and the nation--are experiencing permanent political change? We analyze new data about voter behavior and the electoral landscape to answer this question.
Reviewing New Data: The Electoral Context Changed, but Voter Behavior Didn't
The 2024 election results are being read as a repudiation of Democratic policies in general and the Democratic brand in particular. Recent surveys show that perception of Democrats is at an all-time low, with less than 30% of registered voters having a positive opinion of the party. The election results and many post-election conversations have some wondering if Republicans are on the path toward creating a new multiracial, working-class coalition. The current sentiment is that the Democratic Party is in deep trouble.
There is no debating the depth of the loss for Democrats in 2024: Democrats lost ground among virtually every demographic group in Pennsylvania compared to 2020, most notably among the party’s core minority constituencies. The pre-election happy talk was that voters’ concerns about the state of democracy and the rescinding of abortion rights would lift Democratic candidates, particularly as those issues would create enormous advantages among women and suburban voters. The surprising losses among key groups, the inability to create large advantages among women and suburban voters, the failure of key messages, and the Democrats’ disorganized response to the Trump administration’s efforts to remake government have some believing that the country is witnessing a permanent political change.
But these current conversations ignore a good bit of recent history. The 2024 election did little to suggest that the electoral landscape in Pennsylvania, or nationally, is going to be anything but competitive for the near future. If you look closely enough at the data, it becomes clear that voters were consistent in their behaviors in 2020 and 2024 despite the different outcomes—the electoral context changed, but the motivating behaviors did not.
A close look at two sets of recently released data about the preferences of Pennsylvania’s voters in 2024 is a starting point for trying to understand the current state of the parties.[i] Highlighted below are five conclusions about the 2024 presidential election that are supported by this data.
1. Voters Were Unhappy and Voted for Change
Polling throughout the fall showed that the state’s electoral environment would be more favorable for Republicans than Democrats. Pennsylvania voters were more pessimistic than optimistic about conditions in the state with about half reporting the state was “on the wrong track.” Concern about the economy, including unemployment and higher gas and utility prices, was the most important and frequently mentioned problem facing the state.
In the final F&M Poll before the election, two in five respondents said they were “worse off” financially than they were a year ago, meaning voters were much less optimistic about their personal financial circumstances than they were at the time of the last presidential election in October 2020. As a result, President Biden’s job approval ratings were dismal—only one in three voters rated his performance as “excellent” or “good.” These ratings were far below where a first-term incumbent needed to be to win re-election, which was a drag on the Harris campaign.
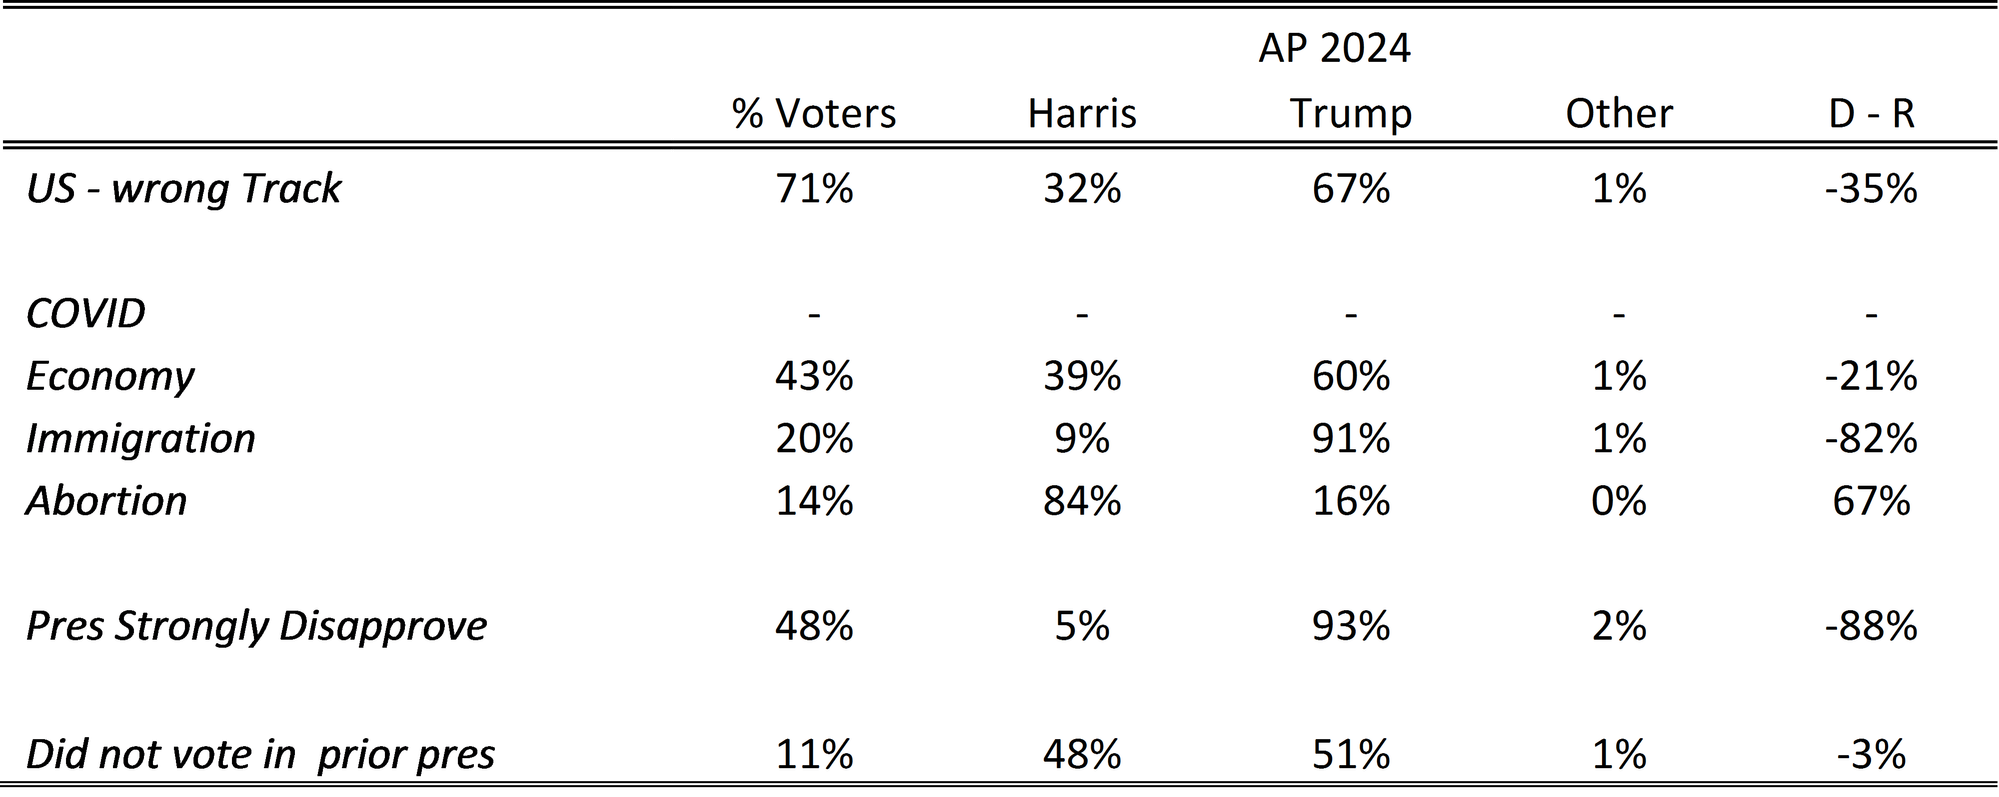
These sentiments drove voter behavior, both in determining who turned out to vote and who those voters chose to vote for. AP VoteCast data showed that the economy (43%) was the top issue for the state’s voters and that Trump beat Harris among these voters, 60% to 39% (Table 1). Those who strongly disapproved of the President’s performance, which was about half (48%) of voters, preferred Trump 93% to 5%. Seven in ten (71%) voters thought the US was on the wrong track and these voters preferred Trump to Harris 67% to 32%.
Table 1. Selected Attitudinal Beliefs and Presidential Preferences, Pennsylvania 2024

Further, the F&M Poll post-election re-interviews specify how important concerns about the economy and Biden’s job performance were to voters. Of course, partisanship affects perceptions of presidential job performance and many other attitudes, but attitudes about the economy and Biden can help understand how people voted even after accounting for their partisan leanings. Table 2 classifies partisans according to their ratings of Joe Biden as president and their beliefs about which candidate would do better handling the economy. The importance of partisanship to perceptions is evident: most Republicans (84%) rated Biden poorly and believed Trump would be better on the economy, while most Democrats (87%) rated Biden positively and believed Harris would do a better job dealing with the economy.
But there were small groups within each party who thought and voted differently than their co-partisans. Among the 11% of Republicans who gave Biden more positive ratings than other Republicans and felt Harris would do a better job on the economy, only 6% reported voting for Trump. Among Democrats, only 8% rated Biden poorly and thought Trump could do better on the economy, and almost all of those Democrats (95%) voted for Trump.
The benefit of knowing these perceptions is particularly useful for understanding the preferences of self-described independent and unaffiliated voters. These independent voters were evenly split on their presidential approval and economic leadership preferences and those attitudes were decisive in who those independents voted for.[ii]
Table 2. Presidential Preference by Party, Presidential Approval Rating, and Perceived Effectiveness Handling the Economy, Pennsylvania 2024.
|
Party |
Presidential Approval |
Better on Economy |
% of Party |
% Trump |
|
Republicans |
Exc, Good, Fair |
Harris |
11% |
6% |
|
Poor |
Trump |
84% |
99% |
|
|
Democrats |
Exc, Good, Fair |
Harris |
87% |
1% |
|
Poor |
Trump |
8% |
95% |
|
|
Ind / Unaffiliated |
Exc, Good, Fair |
Harris |
43% |
3% |
|
|
Poor |
Trump |
43% |
97% |
Source: F&M Post-Election Re-Interviews, Pennsylvania Voters.
2. Compared to 2020, Democrats Performed Worse in Almost Every Demographic Group in 2024
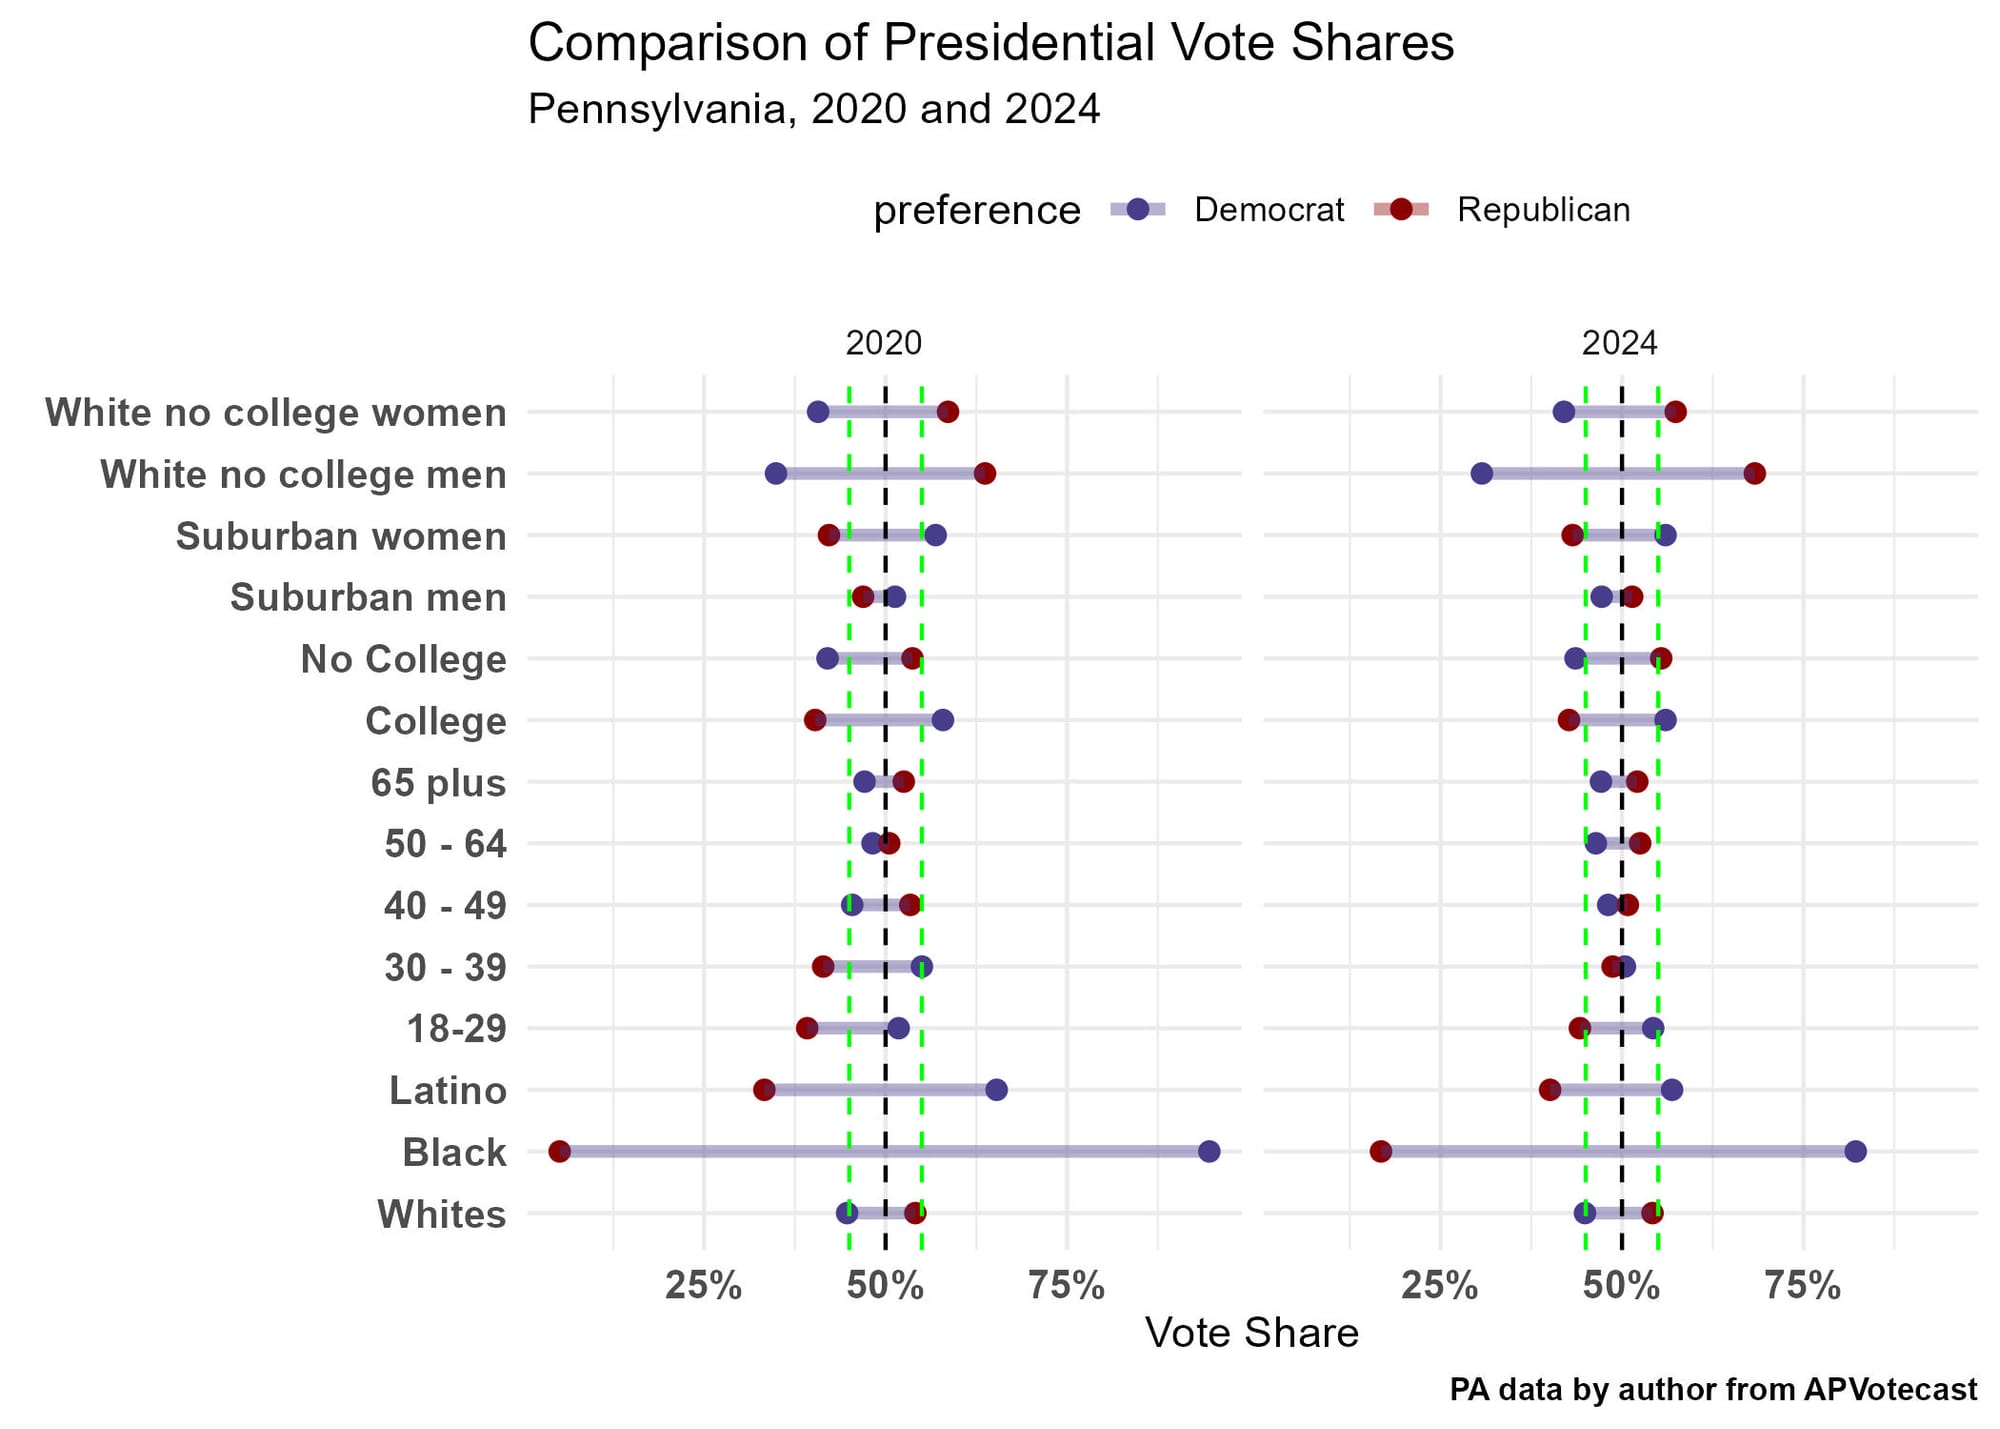
Kamala Harris lost ground within virtually every demographic group compared to Biden in 2020, including college graduates (Figure 1). She basically performed on par with Biden only among women and those having a post-graduate degree. The decline among non-white voters certainly garnered a great deal of attention, rightfully, but a loss of support among independent and first-time voters is also important to note. Biden won independent voters by 16 points in 2020, but Harris carried them only by a single point, according to AP VoteCast data. Biden won first-time voters by nine points in 2020, but Harris lost them by three points in 2024. Suburban men were the only major demographic group to flip from Biden to Trump: Biden won suburban men by four points, while Trump carried them by four points in November. Attachment A includes detailed tables and comparisons to 2020 data for these and other characteristics.

3. Despite the Different Outcomes, Voters Behaved Consistently in 2020 and 2024
First, and most obviously, in both elections partisans overwhelmingly supported their party’s candidate. The AP VoteCast exit survey and the F&M Poll re-interviews both showed that only about 1 in 10 voters split their tickets in races for federal offices in 2024. Straight ticket voting for Republican presidential, House, and Senate candidates represented 46% of voters, and Democratic straight ticket voting in these races represented 45% of voters.
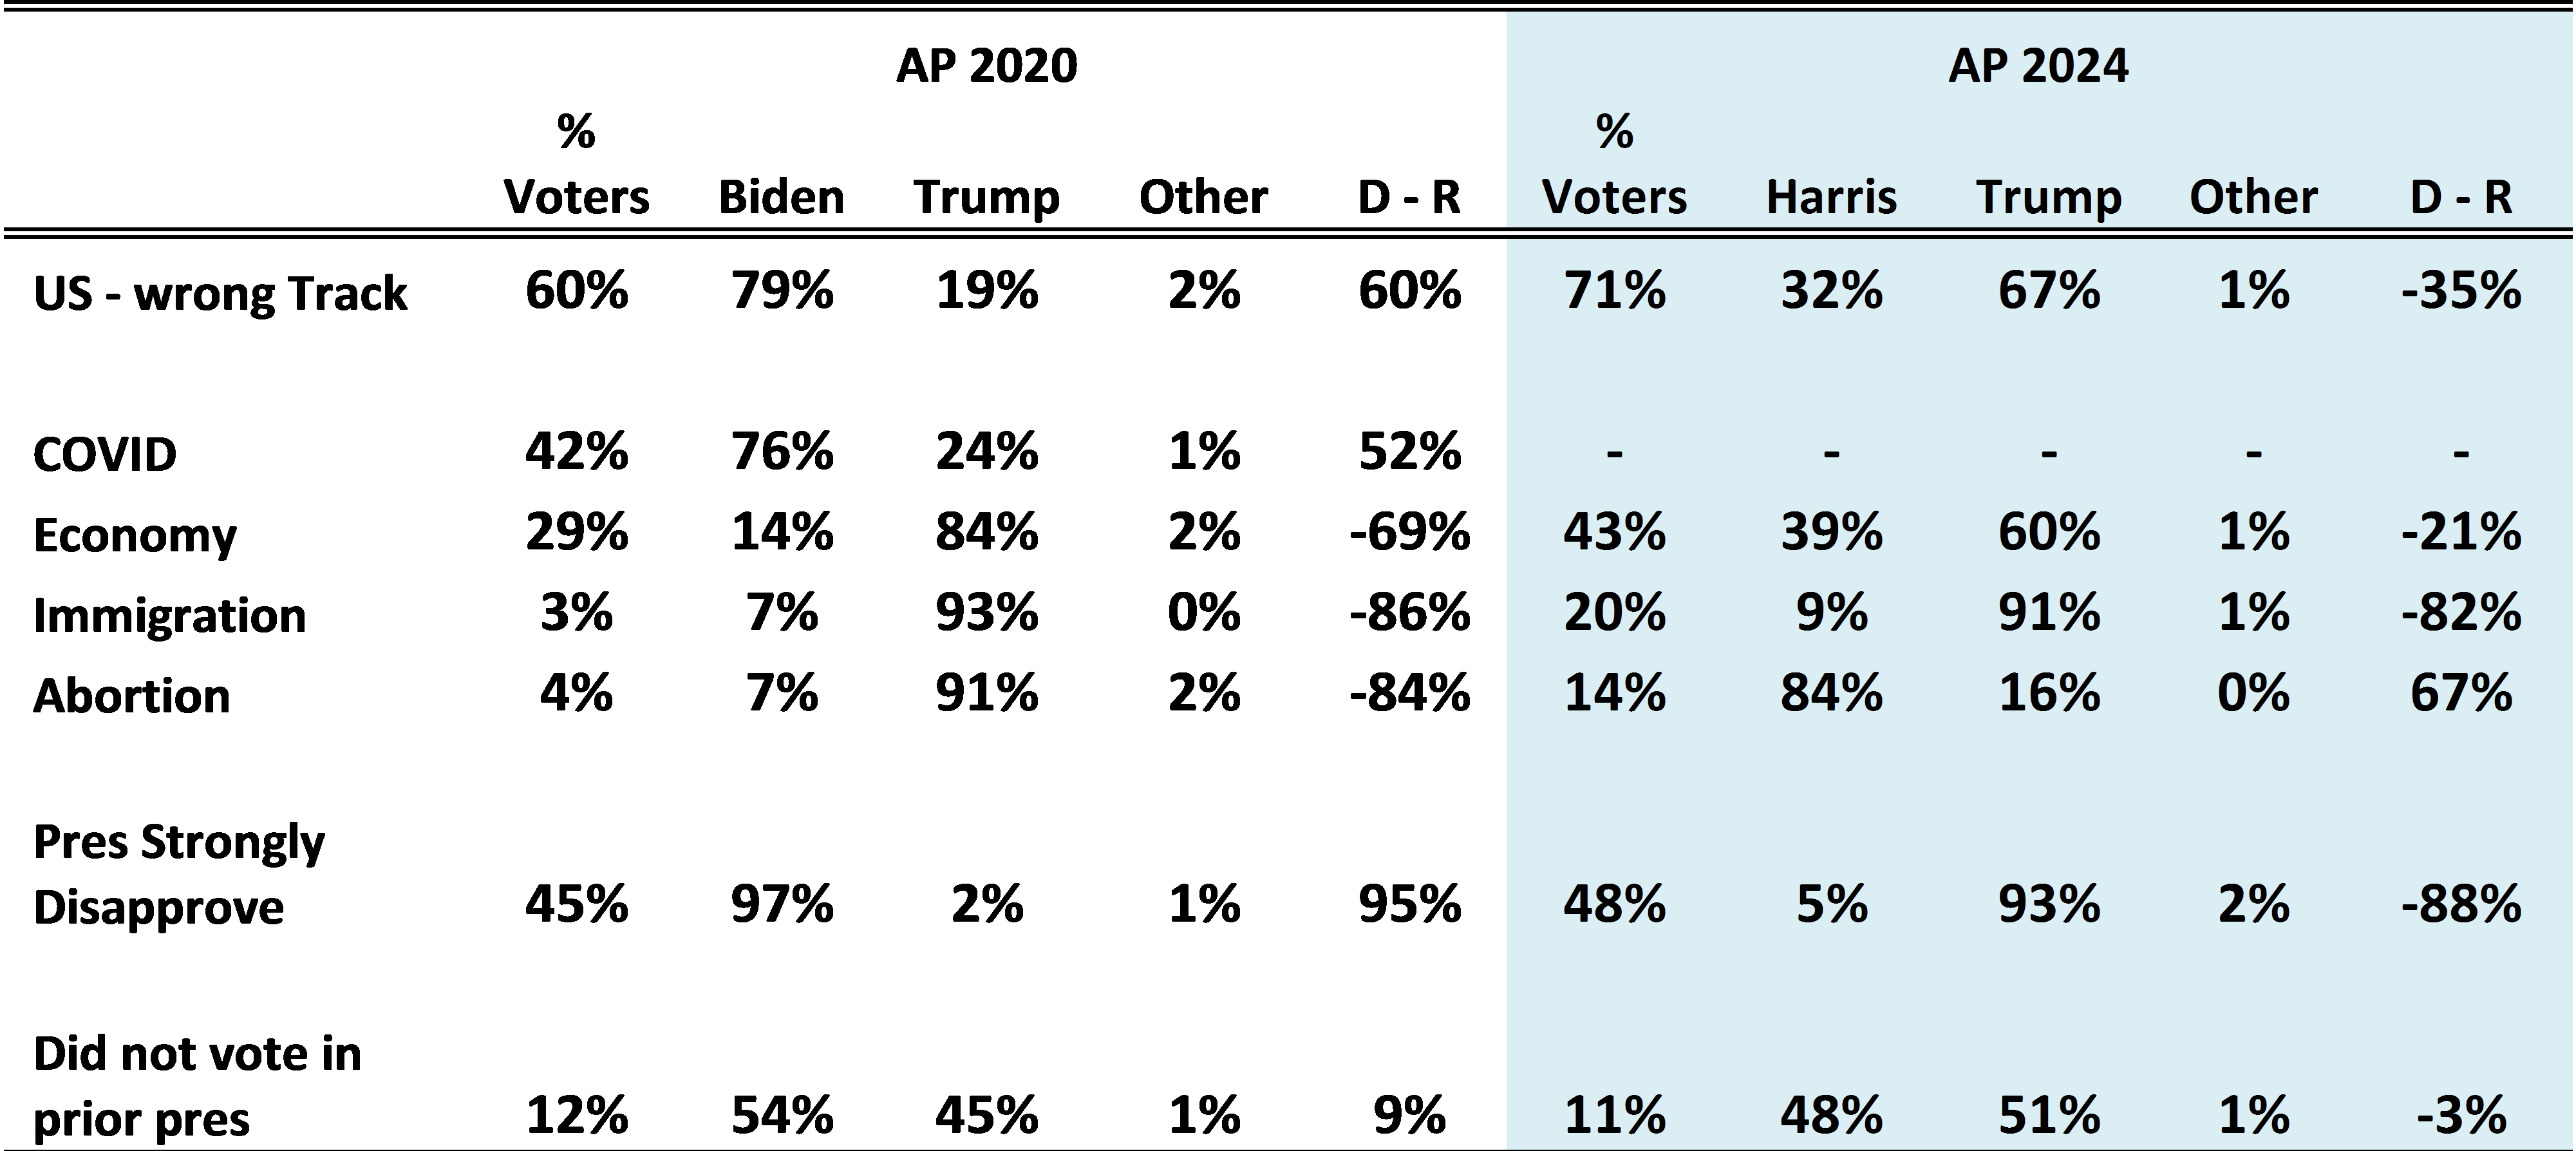
Second, voters’ feelings about how well the incumbent was performing, particularly on the issue they were most concerned about on Election Day, determined the final winner. The major problem in 2020 was COVID-19, mentioned by two in five voters, and Biden won them, 76% to 24%. Nearly half of voters strongly disapproved of Trump’s performance in 2020, and Biden won those voters 97% to 2%. Finally, three in five voters in 2020 thought the country was headed in the wrong direction under Trump and Biden won them, 79% to 19%. Table 3 compares the AP VoteCast estimates for 2020 and 2024 on these attitudinal indicators.
Table 3. Selected Attitudinal Beliefs and Presidential Preferences, Pennsylvania 2020 and 2024

4. The State’s Electorate was More Republican in 2024 than in 2020
Pre-election polls throughout the fall suggested that Republicans were more engaged and likely to vote, and both post-election surveys showed that the electorate had more Republicans than Democrats. Half (50%) of the electorate in 2024 identified as Republican and only 45% identified as Democrat and four percent as independents, giving Republicans a 5-point voter advantage in 2024 compared to a 3-point advantage in 2020 (49% Republican, 46% Democrat, 6% independent).
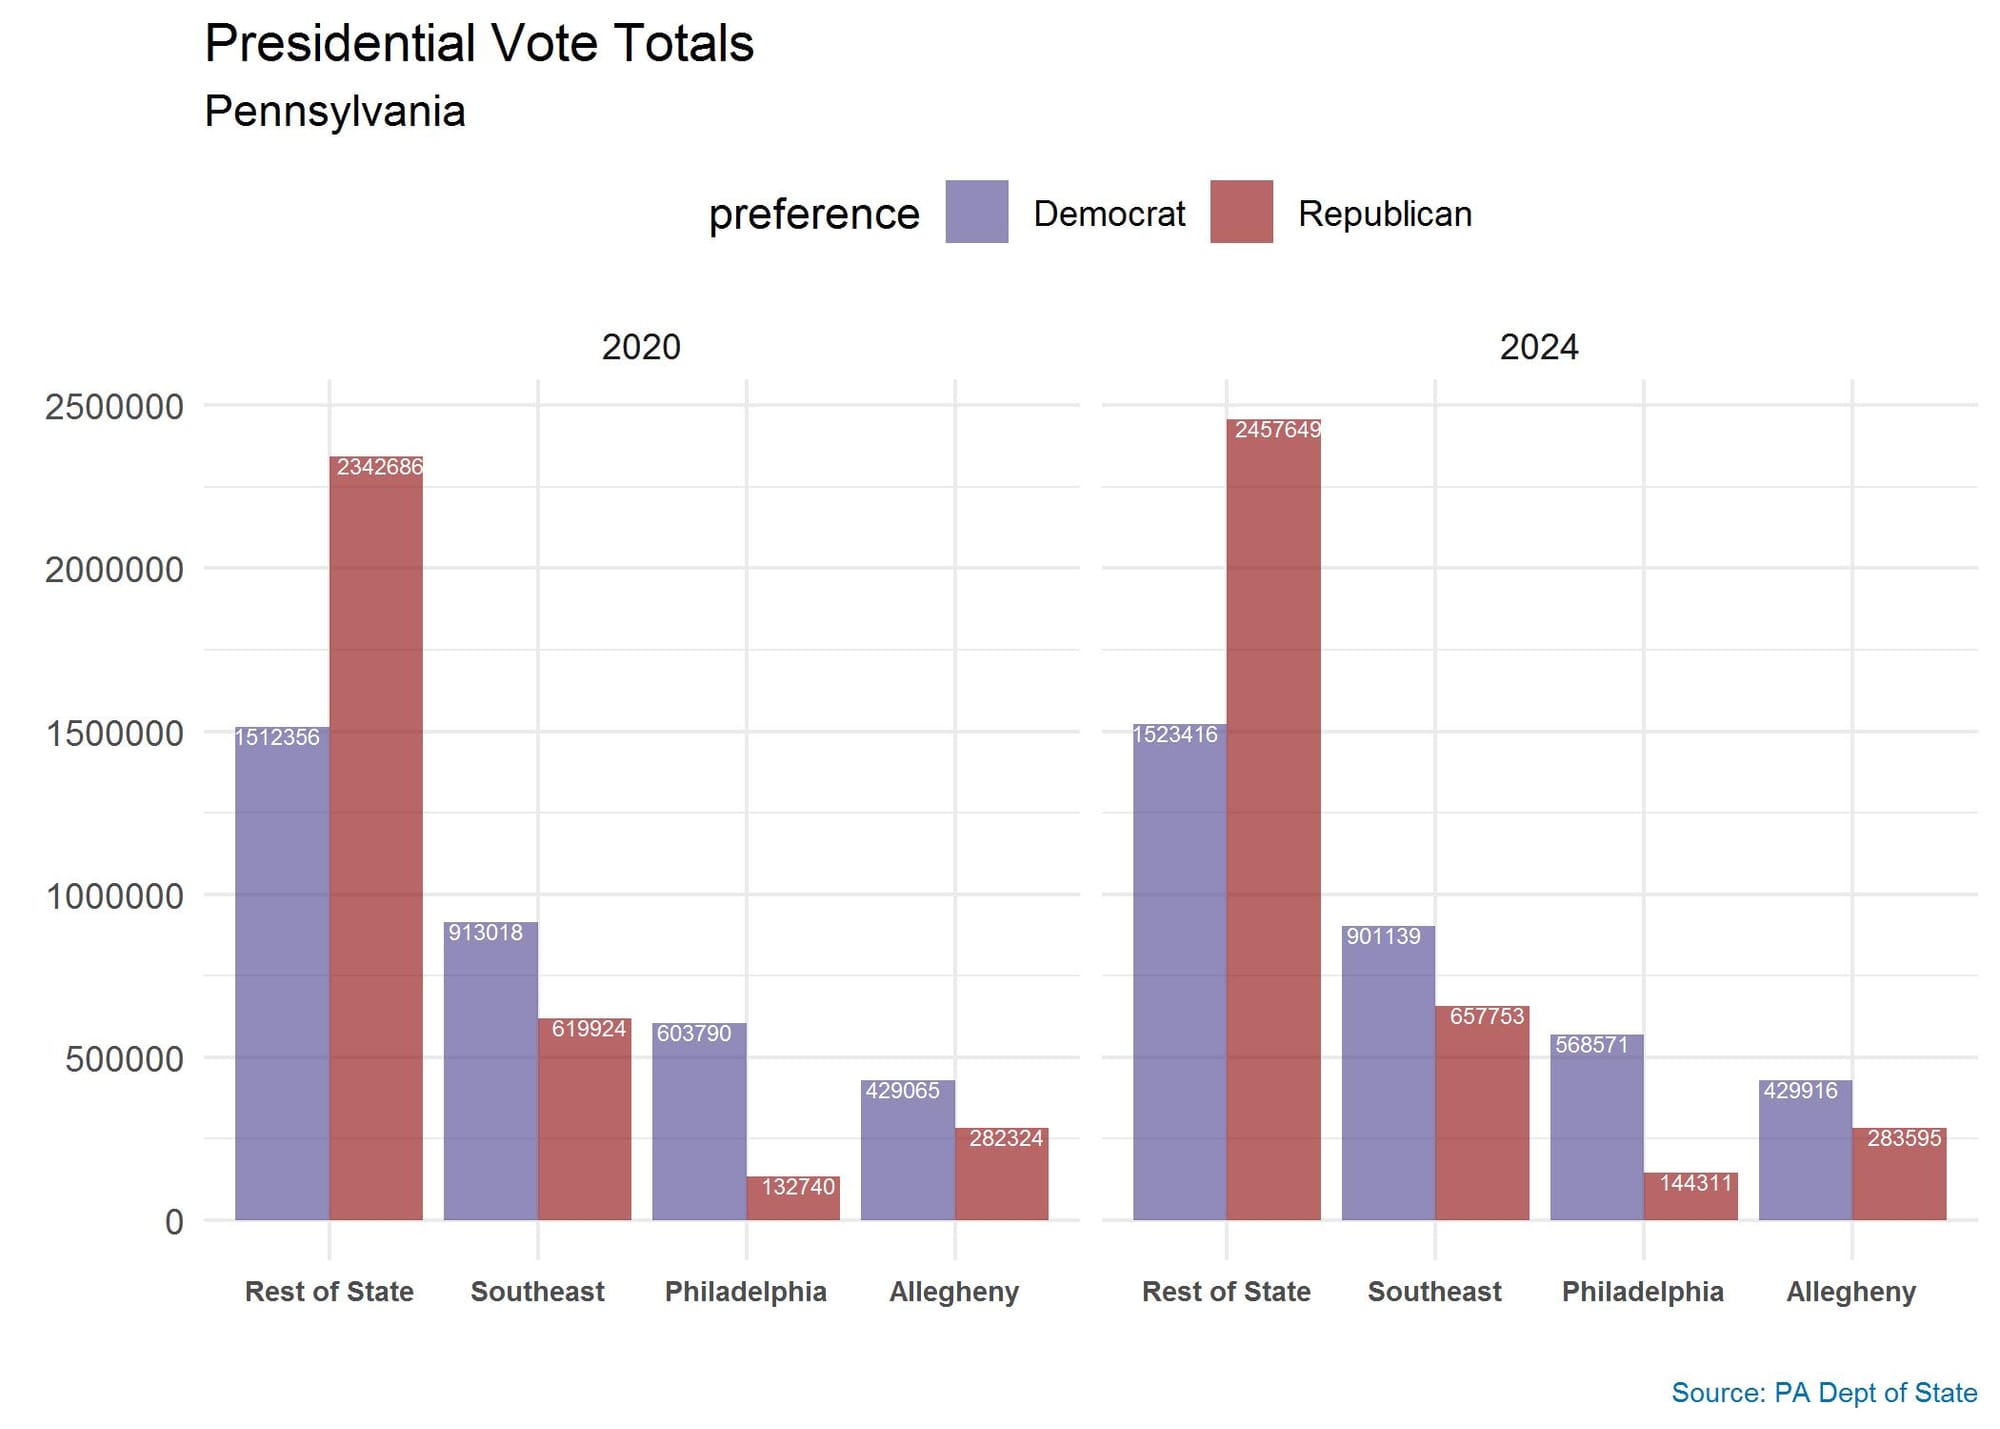
The decline in Democratic vote share in the key Democratic areas of the state was a result of the gains Trump made among traditional Democratic groups, as noted earlier, and it was also about changes in turnout. 2024 turnout overall was up slightly from 2020 among registered voters in the state, but turnout among registered voters was below the state average in 10 of the 13 counties that Biden won in 2020. Philadelphia had the largest gap in turnout, nearly 14 points below the state turnout average for registered voters. Changes in both turnout and support among key groups led to an overall decline in votes cast in the areas of the state that Harris needed to win (Figure 2).

5. The State Remains a Competitive Battleground
There is always an effort to spin the results in the aftermath of every election, by both the winners and losers. The immediate responses generally get it wrong and reflect an effort by partisans to shape the narrative to their benefit. Trump’s 2024 win was, in electoral terms, very similar to Biden’s win in 2020. Biden won 51.3% of the national vote and 306 electoral votes in 2020 and Trump won 49.7% of the national vote and 312 electoral votes in 2024. There were actually 3.1 million fewer votes cast nationwide in 2024 than 2020.
As Biden and Democrats did in 2020, Trump and Republicans have claimed a “mandate,” which generally means they will over reach in terms of their policies and face a backlash in the 2026 mid-terms. This is also when the interest groups influence the winners’ policy choices, often forgetting the key messages that attracted less partisan voters. When newly elected, Obama, Trump, and Biden each controlled the Senate, House, and White House, and each lost that advantage in their first mid-term.
The reality of our current politics is that we are in a state of heightened party competition and that the fundamentals will largely determine winners and losers. These fundamentals are the best explanation for why one in ten (7%) Trump voters had an unfavorable opinion of him and why more than a quarter (27%) of voters who believe abortion should be “mostly legal” also voted for him.
The state’s voter registration patterns over the past decade show that neither party has a clear advantage heading into any election cycle, and the 2024 results reinforce how competitive and contingent races in the state are likely to remain. Since neither party can build durable, broadly popular policy solutions, all politics in this state will be contextual for the foreseeable future. The voters that decide elections are not ideologues—they are pragmatists looking for solutions. Right now, neither party is able to deliver policy solutions that go beyond the bounds of their normal policies, so our current politics are stuck in place.
NOTES
[i] The first set of survey data comes from post-election interviews with voters who participated in one of F&M’s fall polls. The Center for Opinion Research conducted post-election interviews with 1,247 Pennsylvania voters who participated in our August, September, and October 2024 pre-election surveys. Re-interviews were conducted from November 9 - December 19, 2024. The response rates are 45% for August respondents (416 post-interviews out of 920 respondents), 45% for September respondents (398 post-interviews from 890 respondents), and 55% for October (433 post-interviews from 788 respondents). The second set of survey data comes from AP VoteCast exit polling.
[ii] The choice of these variables was indicated by a logistic regression analysis of voter preferences. See Attachment A for the logistic regression model statistics and coefficients.
Franklin & Marshall College Poll Newsletter
Join the newsletter to receive the latest updates in your inbox.
