
Polling the Presidential Race: Does Methodology Matter?
We explore how various methodologies may affect poll results, looking particularly at how different approaches to sampling and data collection seem to produce slightly different descriptions of the 2024 presidential race.
Dear Subscribers,
Polling methods have changed a great deal in recent years. This month’s newsletter describes how different approaches to sampling and data collection seem to produce slightly different descriptions of the presidential race.
We plan to release the final F&M Poll of this election cycle on October 24th. For those interested in hearing more about Pennsylvania’s role as a key swing state, I encourage you to sign up for this swing state webinar at Columbia University on October 16th.
Thank you for reading,
Berwood Yost
Changes in Polling Methods in Recent Years
You may have noticed that more polls are conducted and reported in Pennsylvania every election cycle, but you may not have noticed the increasingly different ways pollsters gather their data. Last year, the Pew Center wrote about changes in polling methods and found, in particular, that pollsters have become less reliant on telephone-only polls and more reliant on panels that use probability and non-probability methods. This should make anyone who follows the polls curious about the effects that increased methodological diversity is having on how the presidential race is characterized.
For instance, one notable feature of this year’s polling is that the presidential race seems too close to call. Could the many different methodological approaches that pollsters are using this year contribute to the relative stability and tightness of the race, and is this characterization accurate?
The Diversity of Polling Methods
Data about the polls conducted in Pennsylvania show 16 different methodological descriptions for the 57 polls conducted during August and September in the state.[i] Categorizing the Pennsylvania polls into four groups based on their broad methodological approaches as no phone, panel, phone, and unknown shows that the single largest category of polls are panel based (see Table 1).[ii] All but one of the panel-based surveys used a non-probability panel.
Table 1. General Methodological Designs of Presidential Polls in Pennsylvania, August and September 2024
|
Methodology |
Number (%) |
|
No Phone |
8 (14%) |
|
Panel |
27 (47%) |
|
Phone |
13 (23%) |
|
Unknown |
9 (16%) |
Non-probability panels are constructed by finding people who are willing to join the panel, meaning these panels rely on voluntary, self-selected participants. In contrast, a probability sample begins with a listing of the population that includes all or almost all the population of interest and the survey participants are selected from that list at random. Probability-based telephone surveys were for a long time considered the gold standard for public opinion polling, but in 2024 these kinds of polls are a small share of the polls being conducted and reported in the media.
The Implications of Polling Method
Plotting the results of polls by these different approaches shows how the methodological choices pollsters make have consequences on the results they produce. While all of these methods suggest a relatively close race, each method differs in how to characterize the presidential race. While every method except the unknown shows an increasing share of the vote for both candidates over time, polls that do not include a telephone component consistently show a lead for former President Trump (Figure 1). Polls that include a telephone component show a larger advantage for Vice President Harris, and the panel-based surveys show perhaps a slightly improving advantage for her.
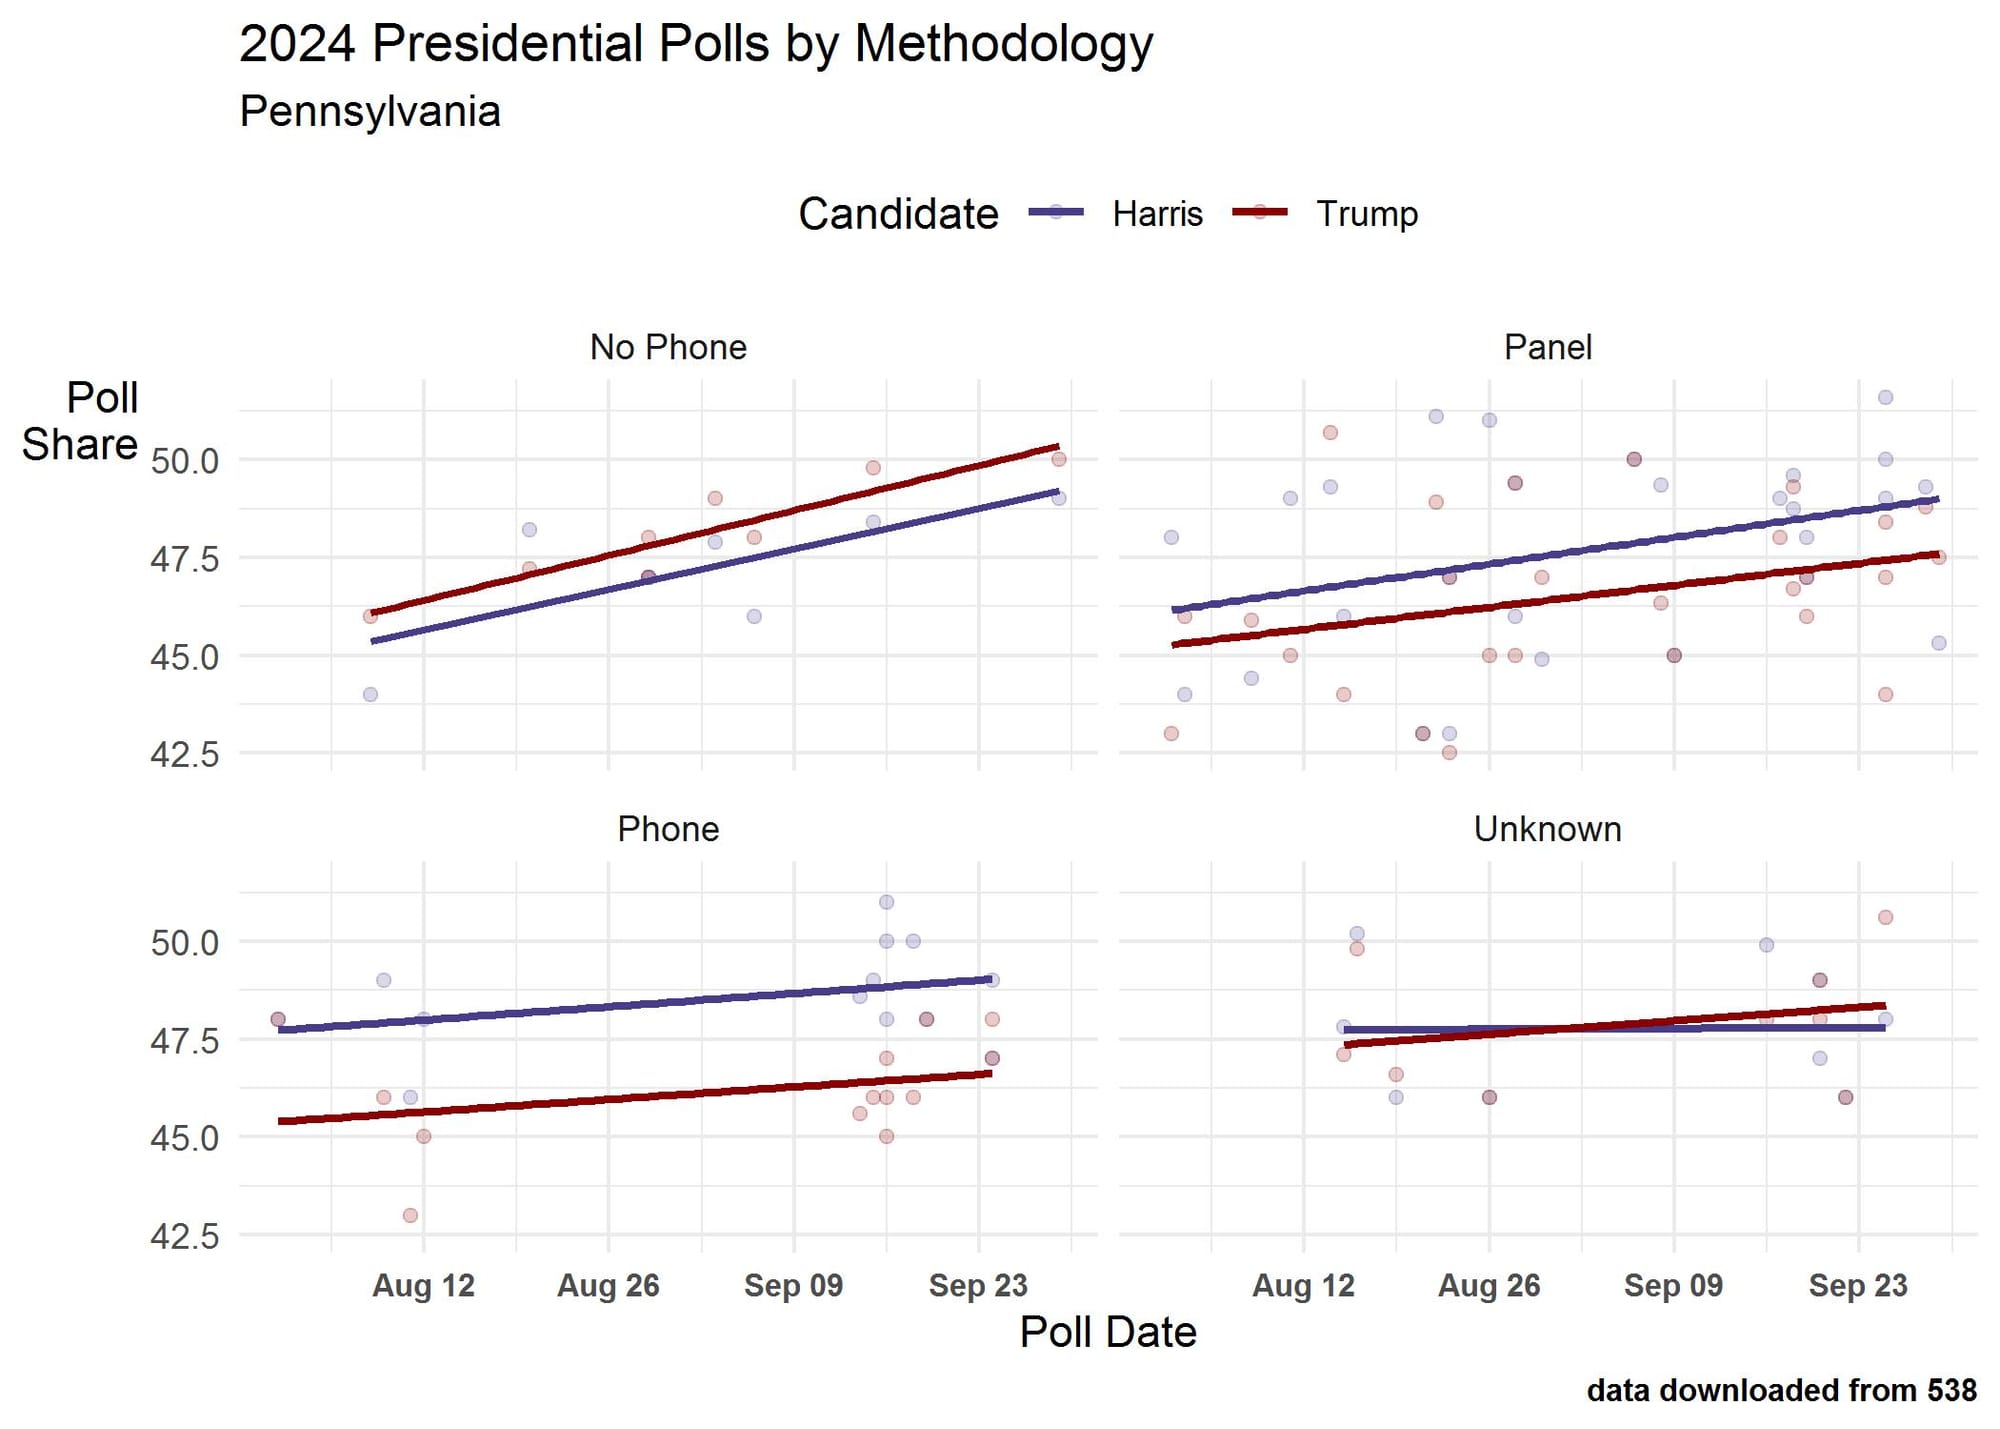
Figure 1. 2024 Presidential Polls by Methodology, Pennsylvania. This figure shows how different methodological designs for polls conducted in Pennsylvania during August and September produce somewhat different perspectives on the presidential race.
A more sophisticated analysis of vote share over all of these polls makes this pattern clear in the aggregate. Polls that do not include telephone calls show a small Trump advantage, while those with unknown methods tend to show a closer race with a slight advantage for Trump (Figure 2). Polls that include telephone interviews tend to give Harris her largest advantage, as do polls based on panels, but by a slightly smaller margin. Moving from left to right in Figure 2, we see a one-point Trump lead, a one-point Harris lead, a 2.5 point Harris lead, or a miniscule Trump advantage. Running the analysis on all swing-states shows the same pattern: surveys that do not include telephone calls consistently show a small Trump advantage.
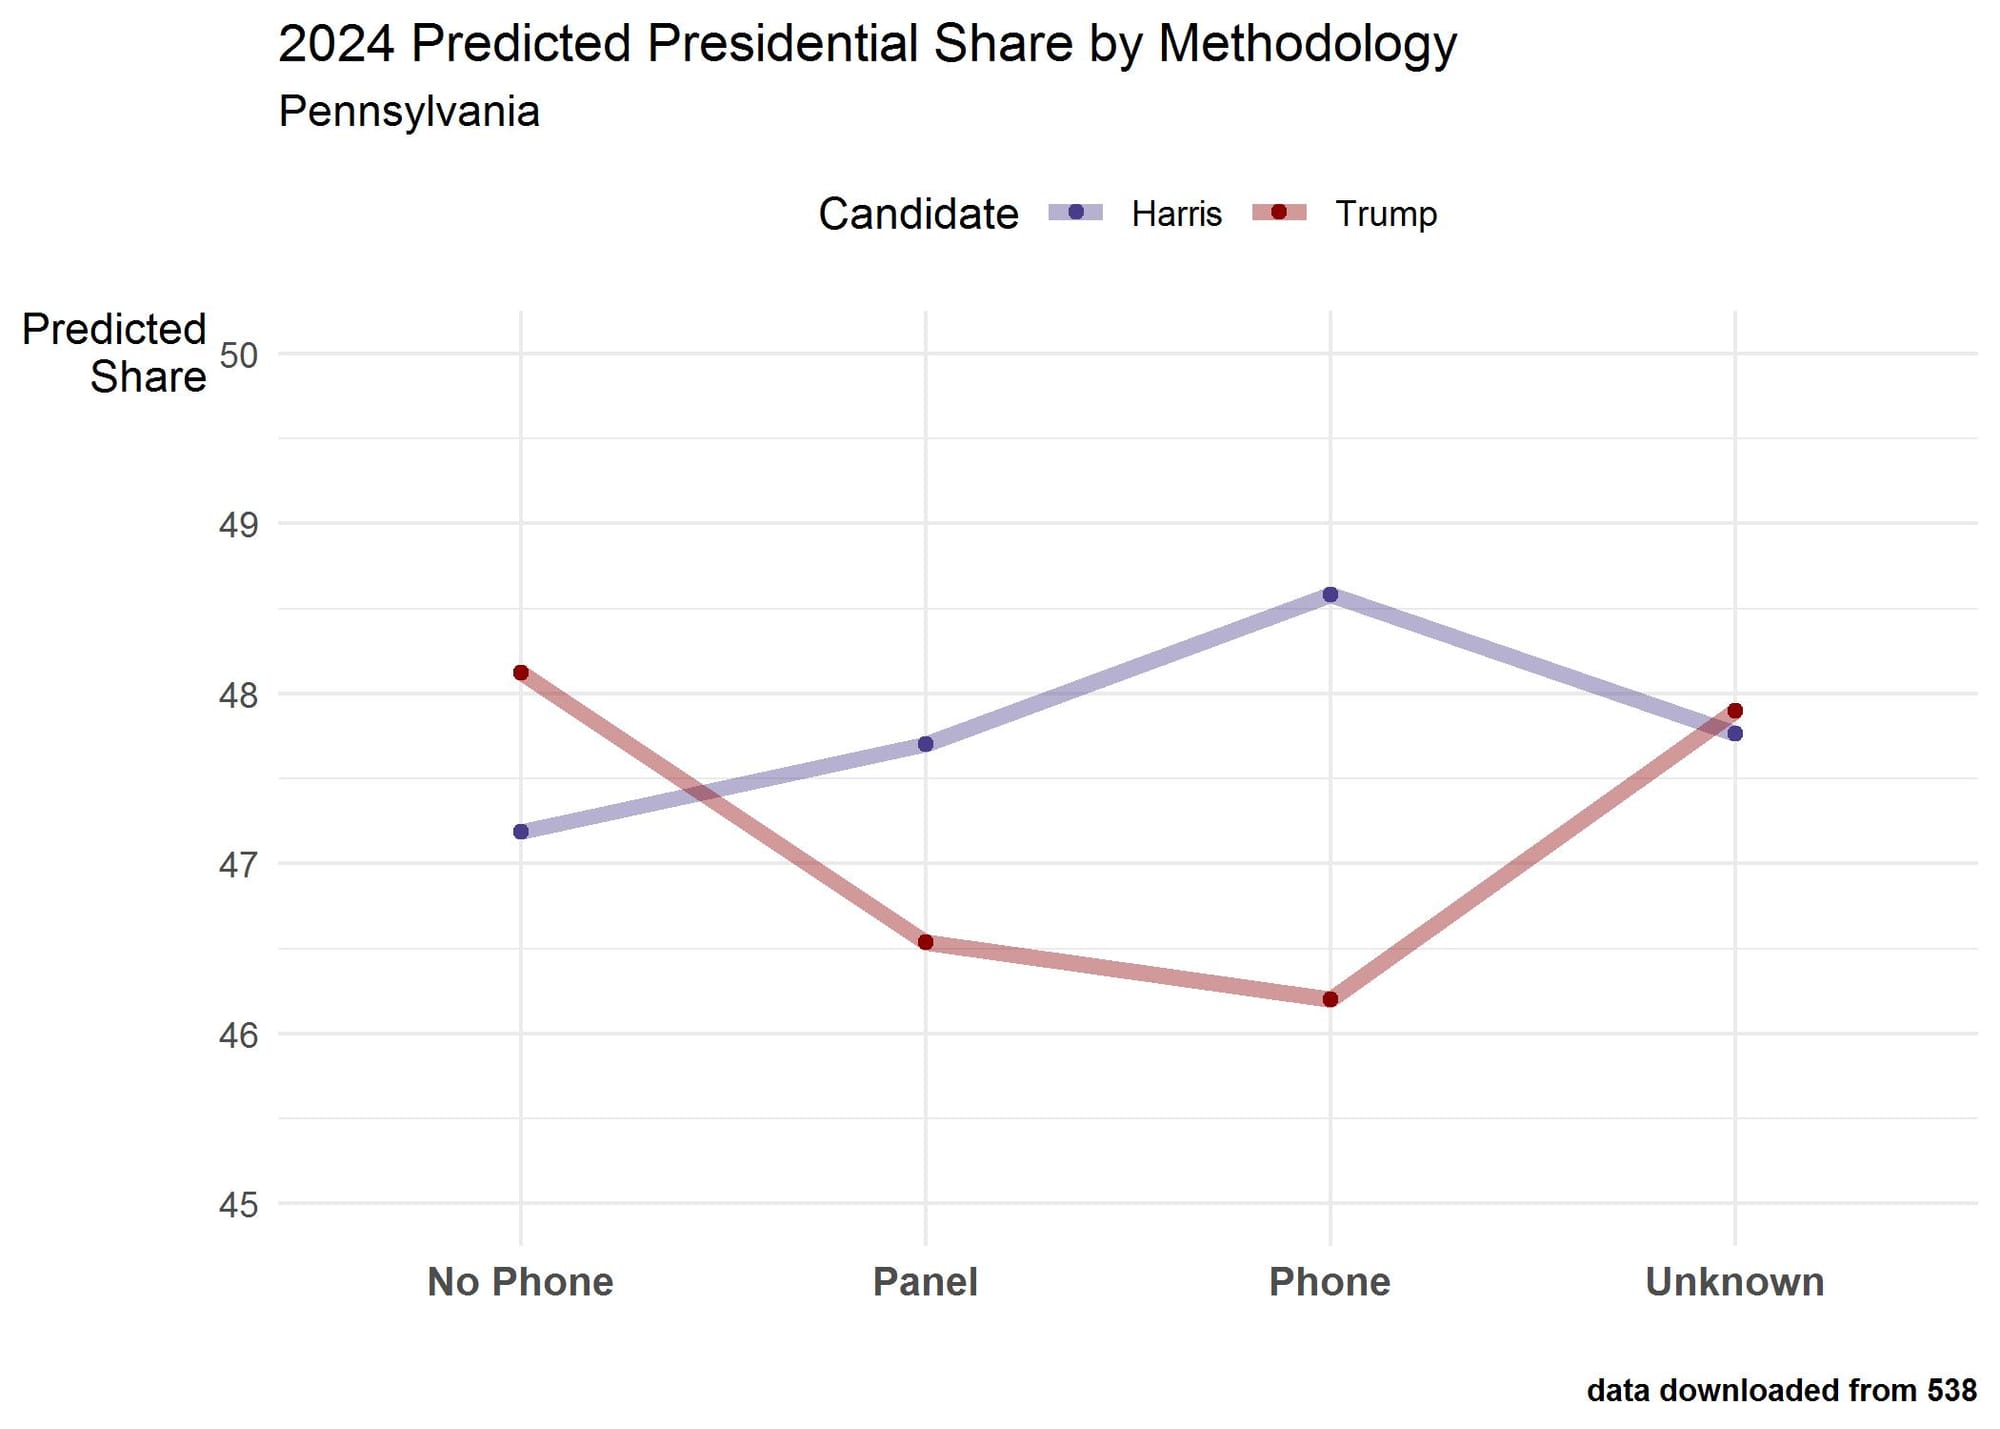
Figure 2. Predicted Vote Share for 2024 Presidential Polls by Methodology, Pennsylvania. This figure shows the estimated effects of survey methods on survey estimates of polls conducted in Pennsylvania during August and September.
The Importance of Transparency
Which of these findings is closest to reality is anyone’s guess, and we will not know until after the election if one of these many different methods of gathering data worked best to capture the dynamics of the presidential race. But as we think about what the polls are saying, we should remember that pollsters’ methodological choices have consequences. The analysis shared here is simple and focuses mainly on the choices that pollsters make about their sampling and data collection procedures. A deeper and more comprehensive look at these pollsters’ methods would likely find additional variables to consider.[iii]
All of this serves to remind us that we must understand how the polls we follow are conducted. Unfortunately, most pollsters do not provide enough information about the way they do their work for us to make those judgments. Using the 538 Transparency Ratings, for example, shows that polls using traditional methods tend to provide much more information about their methods than the polls that make use of less traditional methods (see Table 2). Transparency scores range from 1 to 10 and a higher score means that more information is provided about a pollster’s methods.
Table 2. 538 Transparency Scores by General Methodological Designs of Presidential Polls in Pennsylvania, August and September 2024
|
Methodology |
Mean (SD) Transparency Score |
|
No Phone |
5.2 (1.6) |
|
Panel |
5.8 (3.0) |
|
Phone |
8.0 (1.9) |
|
Unknown |
5.5 (2.3) |
I have written about the importance of survey transparency in past newsletters, but the need for transparency is more important than ever because of the wide variety of approaches pollsters are using today. We should all be paying more attention to the details, not just the aggregates.
More Resources about Polling
This page provides a list of publications about survey methods from the American Association for Public Opinion Research.
This page provides information about standards and ethics in polling.
This recent article discusses polling error and expectations about what polls can and cannot tell us.
This video includes a discussion about why recent polls in Pennsylvania shows slightly different outcomes.
[i] Data were downloaded from https://projects.fivethirtyeight.com/polls/pennsylvania/ on October 2, 2024. The methodology description in the downloaded file included: App Panel, IVR, IVR/Live Phone/Text/Online Panel/Email, IVR/Online Panel/Text-to-Web,IVR/Text, IVR/Text-to-Web, Live Phone, Live Phone/Online Panel/Text-to-Web, Live Phone/Text-to-Web, Mail-to-Web/Mail-to-Phone, Online Ad, Online Panel, Online Panel/Text-to-Web, Probability Panel, Text, Text-to-Web, as well as some that have no methodological description included. The 538 data may include data from the same poll multiple times; for instance, a single poll could have a registered voter estimate, a likely voter estimate, an estimate for the major party candidates, and an estimate for major party and third party candidates. The data were de-duplicated to remove multiple reports for the same poll. There are 57 individual polls counted.
[ii] The no phone group includes any survey that used either one or multiple data collection methods except for a telephone component. The phone group includes any survey that used a telephone only or some mix of telephone and other data collection method. The panel group includes surveys that used a panel in some form regardless of how the data was gathered and regardless of whether the panel was a probability or non-probability design. The unknown group did not have a clear methodological description and could not be classified in one of the other groups.
[iii] The New York Time’s recent article about recalled past vote as a weighting variable is another example of how methods affect estimates (https://www.nytimes.com/2024/10/06/upshot/polling-methods-election.html).
Franklin & Marshall College Poll Newsletter
Join the newsletter to receive the latest updates in your inbox.