
Who are the Undecided Voters? Are There Really Only 3%?
Close analysis of the data suggests there are more undecided voters out there than many pollsters think, and persuadable voters are defined along ideological and partisan lines.
Dear Subscribers,
Many people want to know more about who the undecided voters are in this year’s election. This month’s newsletter provides some data to help define and describe those voters.
Thank you for reading,
Berwood Yost
Identifying Undecided Voters
The competitiveness of the 2024 presidential race and the narrow margin between the candidates in battleground states like Pennsylvania has created massive interest in voters who are undecided about their preferences. When the undecided are defined as those who don’t know who they will vote for in the presidential race, there seems to be only a small number of them. The August 2024 F&M Poll found only three percent of voters were undecided, matching the overall average of the undecided vote share in Pennsylvania according to the PoliticsPA Poll Tracker. Having such a small share of undecided voters at this point in the race seems to make sense given the millions of dollars spent on advertising and because most voters have already formed judgments about the candidates: few voters say they don’t know enough about the candidates to have formed an opinion about them.
On the other hand, having such a small share of undecided voters in August is counter to historical norms. As we noted when discussing the undecided voters in the 2022 mid-term elections, “post-election surveys of voters conducted as part of the American National Election Surveys between 1948 and 2004 show that an average of 17% of voters made their final decision about who they would vote for in those presidential races during the last two weeks of the election. Exit polls from 2016 put that number at 15%, although they also suggested it was much lower in 2020 at around six percent.”
Counting Voters Who Might Change Their Minds
In addition to voters who don’t express a preference for any candidate in the presidential race, voters who express a preference but say they might change their minds before the election are potentially undecided voters, too. The proportion of undecided voters comes much closer to historic norms if we consider voters who have selected a candidate but also say they might change their minds as potentially undecided. Using the August F&M Poll results, for example, most (85%) voters are “certain” about their preference, one in eight (12%) express a preference but say they are still deciding, and the rest (3%) don’t know who they will vote for.[1] Taken together, this is five times as many potentially persuadable voters than when only the “don’t knows” are counted.
The certain, still deciding, don’t know formulation more clearly shows that the persuadable voters in this race are defined along ideological and partisan lines. Ideologically, nine in ten liberals and conservatives say they are certain about their vote choice, with only about two percent of them saying they are still deciding how they will vote. About one in six (17%) moderates says they are still deciding, and about six percent of them say they don’t know. Moderates make up the largest ideological share of the state’s voters and, by these estimates, one in four of them are likely still in play.
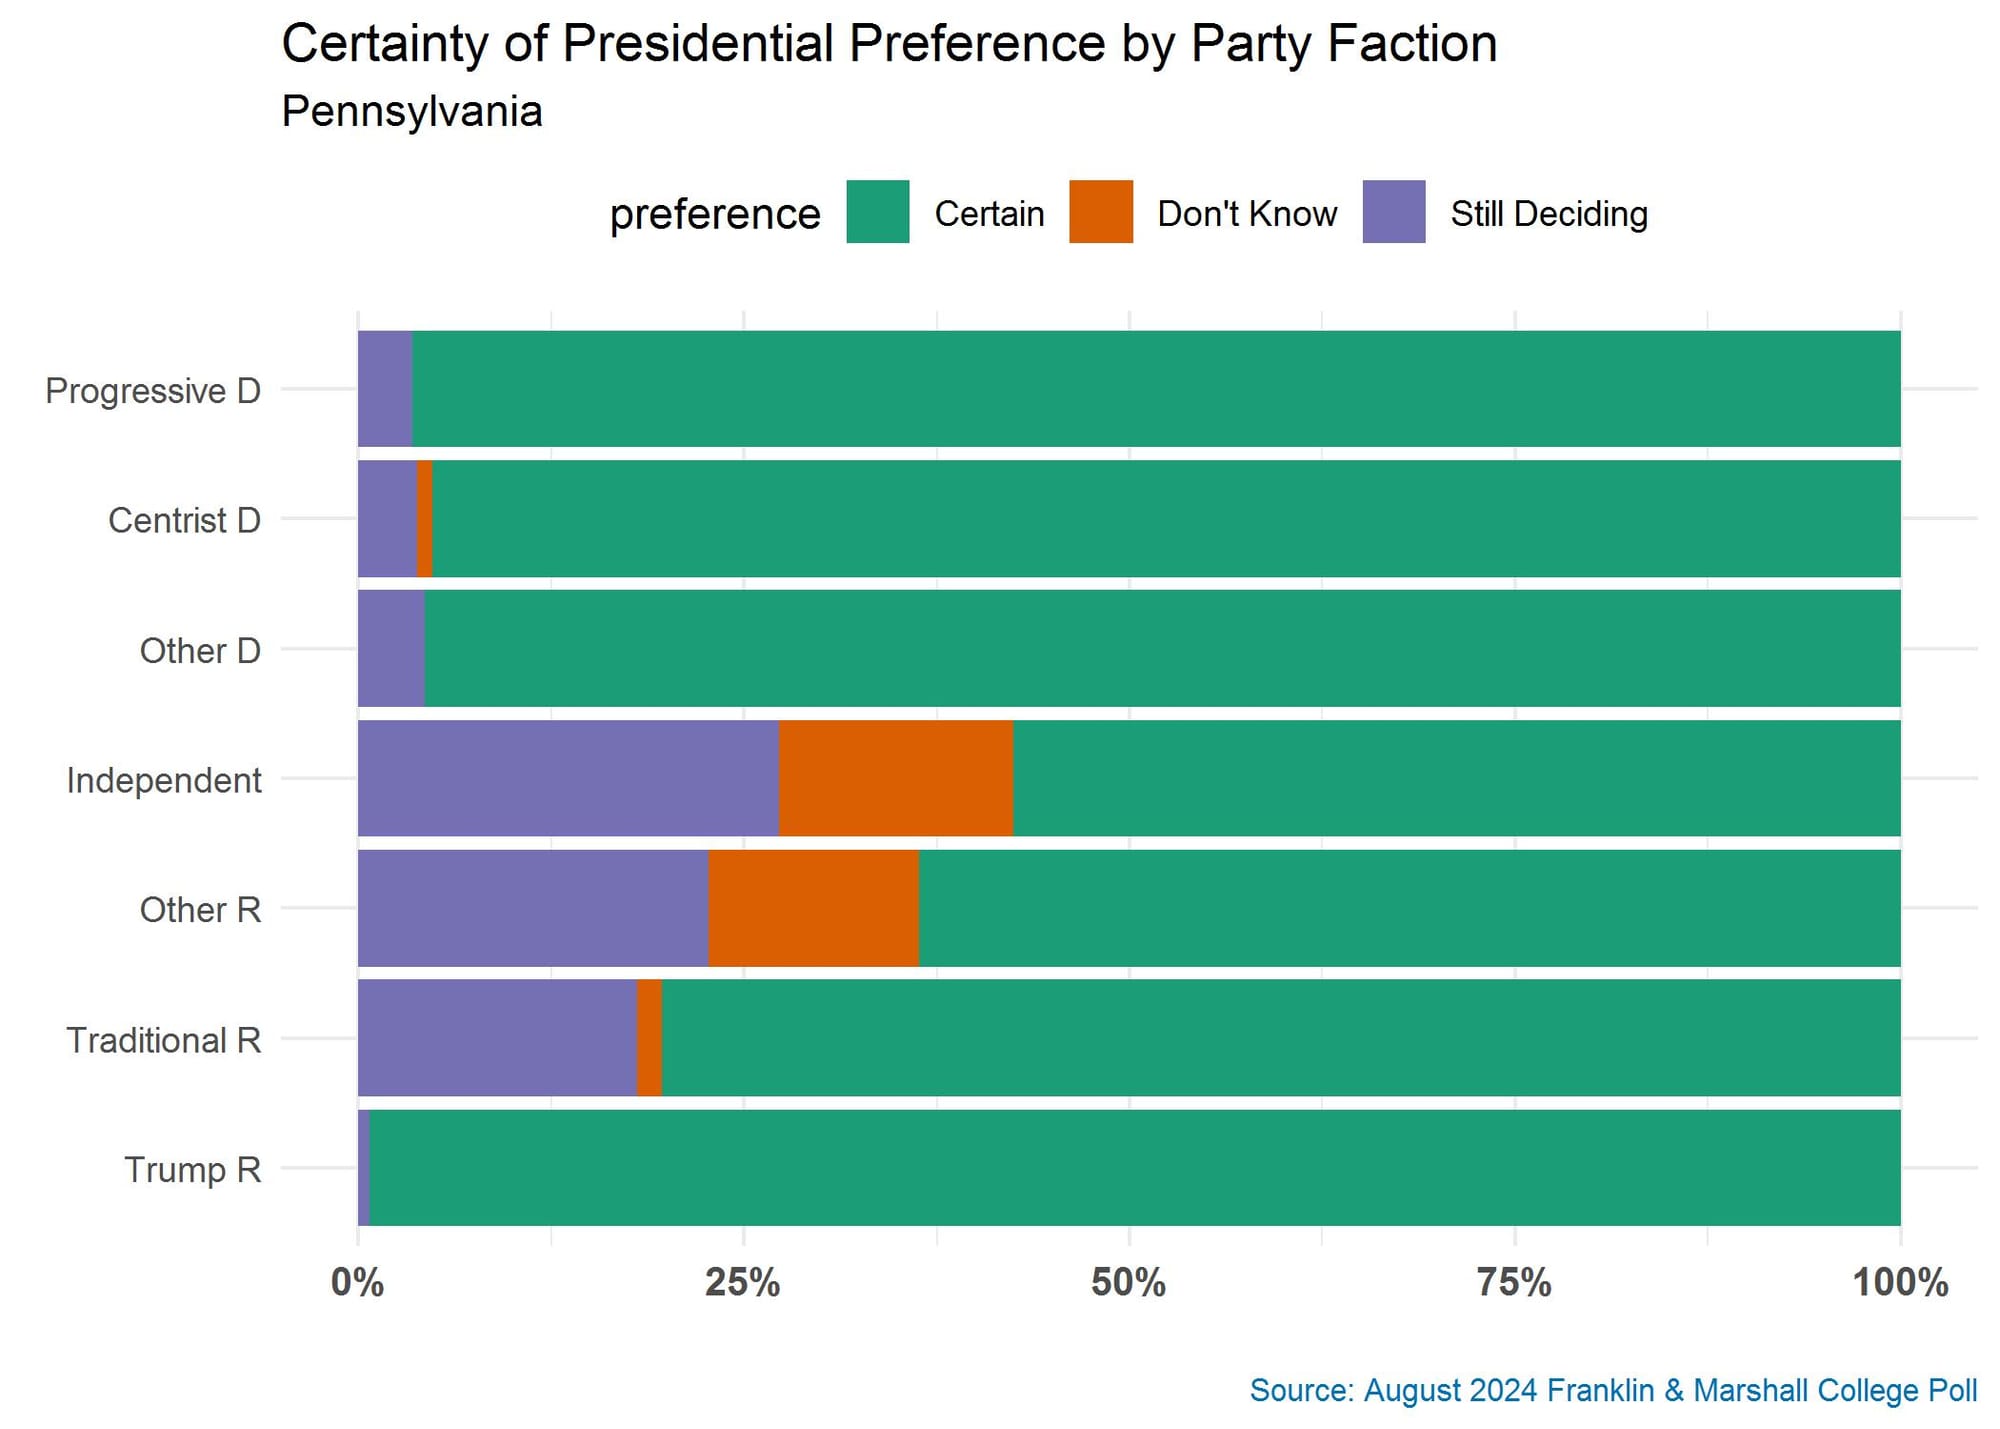
The pattern of undecided voters within each party’s factions is even more interesting. Democrats exhibit strong cohesion in their preferences: ninety-five percent or more of each Democratic faction reports being certain about its preference for president. The Republican factions seem less unified right now than the Democrats. All of those in the Trump faction are certain about how they will vote, but traditional and other Republicans seem less certain about their choice. True independents are least likely to be certain about their preference right now, with one quarter of independents saying they are still deciding and 15% saying they are unsure (see Figure 1). This means 40% of independent voters in total still have not made their final choice.
Some voters are still deciding on their presidential preference in part because many of them have negative feelings about the candidates. The still deciding voters, despite expressing a vote choice, tend to have more negative than positive feelings about both candidates, and more than a quarter of them feel unfavorably about both of them (see Table 1). Compared to 2020 there are more voters who are still deciding and more voters with unfavorable views of both candidates. Would it surprise anyone if some of them changed their minds?
Table 1. Candidate Favorability Ratings in Pennsylvania by Voter Type, August 2024
|
|
Certain
of Vote |
Still
Deciding |
Don’t
Know |
|
Trump |
|
|
|
|
Favorable |
46% (45%) |
34% (46%) |
7% (22%) |
|
Unfavorable |
54% (55%) |
66% (50%) |
89% (67%) |
|
Harris |
|
|
|
|
Favorable |
49% (53%) |
37% (37%) |
25% (16%) |
|
Unfavorable |
49% (46%) |
62% (44%) |
39% (65%) |
|
|
|
|
|
|
Both Unfavorable |
4%
(3%) |
29%
(7%) |
36%
(49%) |
Note: The numbers in parentheses are the values for Trump and Biden from the August 2020 Franklin & Marshall College Poll.
Understating Uncertainty
Poll reporting that consistently shows only a few undecided voters, though technically correct, suggests that we shouldn’t expect much change in candidate preferences between now and Election Day. This may be a good bet in these polarized times.
But fully demarcating the undecided vote is much more than an academic exercise. It reminds us that some of the common language we use to discuss poll results, though simple to understand, can set expectations that may be incorrect and that clearly underestimate the potential variability that exists within our data. If only three percent of voters are undecided, there isn’t much room for surprises come Election Day. On the other hand, knowing that as many as one in seven voters are still up for grabs reminds us that a much wider range of electoral outcomes are possible. It should also remind us that, despite the best efforts of some people to predict how people plan to vote, a sizable share of voters will always be unsure about what they will do until the time comes to do it. This is why some of us still think a poll is best thought of as a snapshot in time.
[1] Notably, voters were more locked into their choices in August 2020 than they are now, with nine in ten (89%) saying they were certain about their vote choice, four percent still deciding, and 7% saying “don’t know.”
Franklin & Marshall College Poll Newsletter
Join the newsletter to receive the latest updates in your inbox.